Latest Posts
Last edited: 2021-03-15 17:16:45
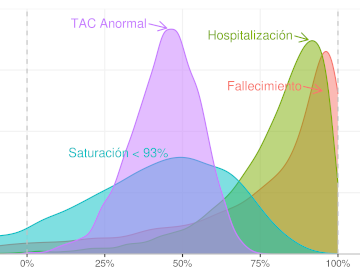
Estimaremos la Eficacia de varias vacunas contra Covid-19 (Pfizer, Moderna, AstraZeneca, y Sputnik), usando el mismo método de estimación para todas, que nos permitirá compararlas mirandolas a través un mismo lente.
Aprovecharemos para evaluar la Eficacia de las dos vacunas Sinopharm ensayadas en Perú, la de los Institutos Beijing y Wuhan, según los datos filtrados a la prensa. Por supuesto, la validez de esos resultados esta condicionada a qué tanto la data filtrada corresponde a la data final y completa del ensayo de las vacunas.
Usaremos el modelo empleado por Pfizer para reportar su ensayo, y también un método más robusto, con un Modelo Bayesiano completo. Ambos modelos son explicados en detalle.
Last edited: 2021-03-14 17:59:01
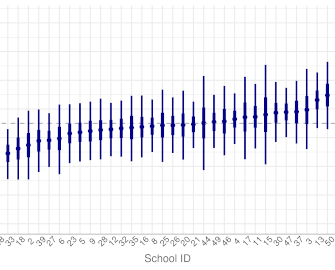
In 1989, Peter Mortimer published "A study of effective junior schools". There he wants to find out how much the students' background influences his/her learning ability. But his main focus is to determine whether individual schools can affect students learning.
We will look at Mortimer's study data, analyzing it as an exercise for practicing multilevel regression using full Bayesian analysis. We will find how much schools make a difference.
Last edited: 2021-03-13 17:16:45
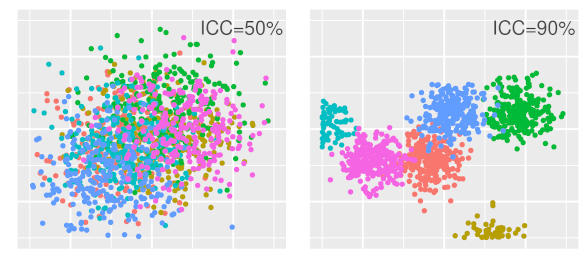
In data analysis, we often want to contrast how certain groups in the data affect an outcome variable. For example, the school's effect on the student's learning, the education on the voter political preferences, or the boss's on employee performance.
When this is the case, doing a separate regression for each group is an analysis option. However, the problem then is that each group's model completely ignores others' observations. Ignoring the general data pattern causes overfitting when there are few observations in a group.
Another alternative is to ignore the groups and do a single regression for all the data. But when the analysis's focus is to compare each group's effect, this path is not feasible.
A multilevel regression incorporates in a single model both the trend within each group and the general pattern in all the observations, enabling us to find out how much each group affects the outcome variable.
Last edited: 2021-04-05 14:59:23
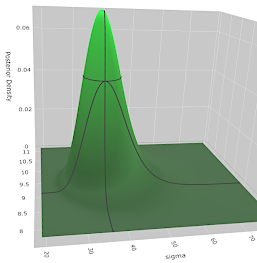
The Bayesian paradigm treats the model’s parameters like random variables whose different values make the model produce data that is more or less likely to come from the same distribution as the observed data.
This post develops the Bayesian inference concepts through their application in a practical example, solving a simple regression model numerically, in a fully Bayesian way. We will match the theoretical concepts with their practical implementation, helping you to grasp their meaning entirely.
Last edited: 2020-12-31 16:16:20
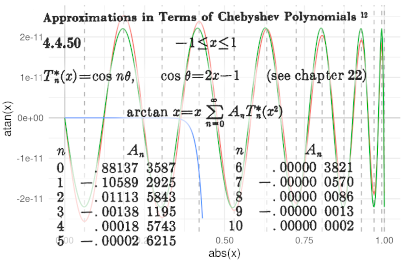
When I was young, I was curious to know how a computer calculates functions such as the cosine, the logarithm, or the tangent's inverse, the so-called elementary transcendental functions.
It turns out that they are calculated with the so-called Chebyshev polynomial approximation, where you get each polynomial coefficient by solving an integral.
In some cases, you need a couple of tens of coefficients, so there are lots of integrals to solve. It is more complicated when the function you want to approximate appears in those integrals, because you don't have how to calculate that function yet, and that's precisely why you want to have the approximation!
With patience and a little luck, I could analytically solve the approximation to some of these functions; and here I will tell you how I did it.
Last edited:
Last edited:
 <p>We have analyzed the noise in raw images, proposed a raw noise mathematical model and saw how this model arises from the sensor characteristics. Also, we have compared real raw image noise data against this model —using R-language— and found how this data corresponds very close to the model. Also we have seen it is not easy to correlate that data with the model, because it suffers an issue called heteroscedasticity.</p>
<p>So far, it has been an exciting journey, giving us the perfect excuse to learn more about the technical basis of photography and to develop and hone our data-analysis skills. However, the knowledge we have acquired, can not really be applied so much in the way we take or develop a photograph. This is because, the photo developing tools (like Adobe <em>Lightroom</em> and <em>Camera Raw</em>, Phase-One <em>Capture One</em>, Apple <em>Aperture</em>, DxOMark <em>Optics Pro</em>, <em>RawTherapee</em>, etc.) isolate from us the raw issues and let us edit the photograph when it has already been converted into a RGB color space. However, this is <em>for our own good</em>, because that way we don't have to deal with the idiosyncrasies, technical issues an gore details of each camera we use.</p>
<p>In summary, the RGB image we can edit and develop, does not have at all the raw noise profile we have studied. Even worse, we don't (at least I don't) have a clue how the RGB image noise is related to the raw one we know. This means we can know our camera has a great raw noise behavior, making us willing to pay more for it, but have no idea how exactly this is reflected in our final images.</p>
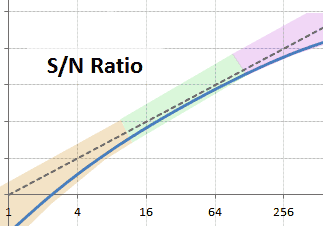
<p>We know —of course— less noise is better, specially in the image dark areas. For example, comparing the camera SNR chart with the other ones of its class, we can rank them by noise performance. But the fact is we don't know how and how much of that raw noise is present in the final developed image.</p>
<p>In this article we will start to fill that gap. We will continue with the study of the image noise, but this time we will learn about how the noise profile changes from a raw image to its equivalent in a RGB space and we will continue the noise study from there.</p>
<p>This kind of analysis requires such a lot of labor that this article wouldn't be possible without the help of a tool automatizing most of it. We will use the <code>imgnoiser</code> R package we introduced in this article. We wont explain in full detail the package usage, for that matter, please check the aforementioned article.</p>
<p>We have analyzed the noise in raw images, proposed a raw noise mathematical model and saw how this model arises from the sensor characteristics. Also, we have compared real raw image noise data against this model —using R-language— and found how this data corresponds very close to the model. Also we have seen it is not easy to correlate that data with the model, because it suffers an issue called heteroscedasticity.</p>
<p>So far, it has been an exciting journey, giving us the perfect excuse to learn more about the technical basis of photography and to develop and hone our data-analysis skills. However, the knowledge we have acquired, can not really be applied so much in the way we take or develop a photograph. This is because, the photo developing tools (like Adobe <em>Lightroom</em> and <em>Camera Raw</em>, Phase-One <em>Capture One</em>, Apple <em>Aperture</em>, DxOMark <em>Optics Pro</em>, <em>RawTherapee</em>, etc.) isolate from us the raw issues and let us edit the photograph when it has already been converted into a RGB color space. However, this is <em>for our own good</em>, because that way we don't have to deal with the idiosyncrasies, technical issues an gore details of each camera we use.</p>
<p>In summary, the RGB image we can edit and develop, does not have at all the raw noise profile we have studied. Even worse, we don't (at least I don't) have a clue how the RGB image noise is related to the raw one we know. This means we can know our camera has a great raw noise behavior, making us willing to pay more for it, but have no idea how exactly this is reflected in our final images.</p>
<p>We know —of course— less noise is better, specially in the image dark areas. For example, comparing the camera SNR chart with the other ones of its class, we can rank them by noise performance. But the fact is we don't know how and how much of that raw noise is present in the final developed image.</p>
<p>In this article we will start to fill that gap. We will continue with the study of the image noise, but this time we will learn about how the noise profile changes from a raw image to its equivalent in a RGB space and we will continue the noise study from there.</p>
<p>This kind of analysis requires such a lot of labor that this article wouldn't be possible without the help of a tool automatizing most of it. We will use the <code>imgnoiser</code> R package we introduced in this article. We wont explain in full detail the package usage, for that matter, please check the aforementioned article.</p>
Last edited:
 <p>In previous articles we have proposed a raw noise mathematical model which arises from the sensor characteristics. Then we have learn how to use this model applying it on noise data from a <em>Nikon D7000</em> camera at ISO 100. Realizing the noise measuring is a labor intensive task, we prepared the <code>imgnoiser</code> R package (<em>"Introducing the imgnoiser R package"</em>)</p>
<p>Now we want to use the <code>imgnoiser</code> R package to build a noise profile of the <em>Nikon D7000</em> at ISO 100. The support from the <code>imgnoiser</code> will help us to devote less time collecting and double checking the data from our procedures and use that released time to make a more extensive analysis.</p>
<p>This article will also be useful as tutorial about the usage of the<code>imgnoiser</code> R package, with practical examples, not from naive situations but from real analysis cases.</p>
<p>In previous articles we have proposed a raw noise mathematical model which arises from the sensor characteristics. Then we have learn how to use this model applying it on noise data from a <em>Nikon D7000</em> camera at ISO 100. Realizing the noise measuring is a labor intensive task, we prepared the <code>imgnoiser</code> R package (<em>"Introducing the imgnoiser R package"</em>)</p>
<p>Now we want to use the <code>imgnoiser</code> R package to build a noise profile of the <em>Nikon D7000</em> at ISO 100. The support from the <code>imgnoiser</code> will help us to devote less time collecting and double checking the data from our procedures and use that released time to make a more extensive analysis.</p>
<p>This article will also be useful as tutorial about the usage of the<code>imgnoiser</code> R package, with practical examples, not from naive situations but from real analysis cases.</p>
Last edited:
 <p>In the article "Developing a RAW photo file 'by hand'" we learned many photograph concepts and how to handle and develop, by ourselves, a raw photo file (without demosaicing). However, an important part of the development process was done using <em>IRIS</em> software, which is a <em>Windows</em> only (free) product, which restricted the users of other OSs to repeat the article exercises.</p>
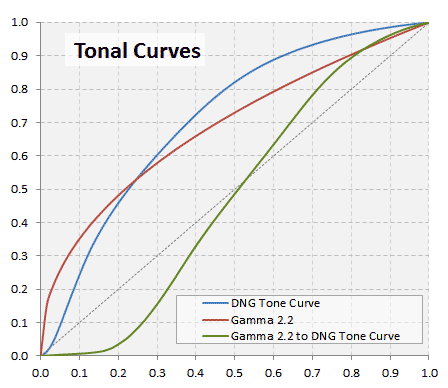
<p>Furthermore, the application of tonal curves has to be done using <em>Photoshop</em>, which automatically makes additional image changes when applying a curve, like hue and saturation adjustment for a <em>better looking</em> image or for film-like results. This is a not at all a 'by hand' DIY kind of tool we wanted to use, but we didn't had any other alternative.</p>
<p>To overcome this, and many other difficulties, we have developed the <code>imgnoiser</code> R Package, and now all the <em>Developing a RAW Photo by hand</em> can be done using this and other R packages.</p>
<p>An additional and great benefit of the photograph development in the R environment, is that you can code your own ideas and make more experiments with the image in a completely impossible way for the environment we used in the original article. As usual, we will include all the required R code to reproduce all the described exercises.</p>
<p>In this post we will explain again the <em>Raw Development by hand</em> but focused in the operational part using R tools, and in new topics, but without explaining the photograph concepts we have already learn in the original post. Also, we wont explain in detail the usage of the <code>imgnoiser</code> package; you can learn about that topic reading the article <em>Introducing the imgnoiser R package</em>.</p>
<p>In the article "Developing a RAW photo file 'by hand'" we learned many photograph concepts and how to handle and develop, by ourselves, a raw photo file (without demosaicing). However, an important part of the development process was done using <em>IRIS</em> software, which is a <em>Windows</em> only (free) product, which restricted the users of other OSs to repeat the article exercises.</p>
<p>Furthermore, the application of tonal curves has to be done using <em>Photoshop</em>, which automatically makes additional image changes when applying a curve, like hue and saturation adjustment for a <em>better looking</em> image or for film-like results. This is a not at all a 'by hand' DIY kind of tool we wanted to use, but we didn't had any other alternative.</p>
<p>To overcome this, and many other difficulties, we have developed the <code>imgnoiser</code> R Package, and now all the <em>Developing a RAW Photo by hand</em> can be done using this and other R packages.</p>
<p>An additional and great benefit of the photograph development in the R environment, is that you can code your own ideas and make more experiments with the image in a completely impossible way for the environment we used in the original article. As usual, we will include all the required R code to reproduce all the described exercises.</p>
<p>In this post we will explain again the <em>Raw Development by hand</em> but focused in the operational part using R tools, and in new topics, but without explaining the photograph concepts we have already learn in the original post. Also, we wont explain in detail the usage of the <code>imgnoiser</code> package; you can learn about that topic reading the article <em>Introducing the imgnoiser R package</em>.</p>
Last edited:
 <p>In a previous article we introduced a <em>"A Simple DSLR Camera Sensor Noise Model"</em> and then we used this model to analyze a camera sensor raw noise in <em>"Use of Linear Regressions to Model Camera Sensor Noise"</em>. Those articles deal with the theoretical and practical basis to analyze noise from raw image samples.</p>
<p>The input to that analysis are samples of photographs taken at different exposition levels, from which we compute the variance and mean of the photosite readings. Until now, we have prepared the samples and computed their variance and mean using <em>Iris Software</em>. But that workflow was very labor intensive, error prone, and inhibit us to further analysis like the study of the covariance between channels in the same sample because <em>Iris software</em> does not bring that information. Furthermore, <em>Iris</em> is a windows only software, which prevents users with other OSs to collect noise data using this tool.</p>
<p>To solve those issues, we have prepared a R package called <code>imgnoiser</code> (from IMaGe NOISE R package). In this article, we introduce you to its usage, which automatizes the acquisition, analysis of noise statistics, letting us to focus in the study, instead of devoting a lot of time to collect the data or to prepare code to study that data.</p>
<p>You can install the <code>imgnoiser</code> package from github using <code>devtools::install_github('oscardelama/imgnoiser')</code>...</p>
<p>In a previous article we introduced a <em>"A Simple DSLR Camera Sensor Noise Model"</em> and then we used this model to analyze a camera sensor raw noise in <em>"Use of Linear Regressions to Model Camera Sensor Noise"</em>. Those articles deal with the theoretical and practical basis to analyze noise from raw image samples.</p>
<p>The input to that analysis are samples of photographs taken at different exposition levels, from which we compute the variance and mean of the photosite readings. Until now, we have prepared the samples and computed their variance and mean using <em>Iris Software</em>. But that workflow was very labor intensive, error prone, and inhibit us to further analysis like the study of the covariance between channels in the same sample because <em>Iris software</em> does not bring that information. Furthermore, <em>Iris</em> is a windows only software, which prevents users with other OSs to collect noise data using this tool.</p>
<p>To solve those issues, we have prepared a R package called <code>imgnoiser</code> (from IMaGe NOISE R package). In this article, we introduce you to its usage, which automatizes the acquisition, analysis of noise statistics, letting us to focus in the study, instead of devoting a lot of time to collect the data or to prepare code to study that data.</p>
<p>You can install the <code>imgnoiser</code> package from github using <code>devtools::install_github('oscardelama/imgnoiser')</code>...</p>
Last edited:
 <p>If you you want to learn about the sources of noise in digital photography and you google that, you will find several interesting explanations about the <em>Read Noise</em>, <em>Photon Shot</em> noise and <em>PRNU</em> noise as components of the total raw image noise. </p>
<p>Those explanations say for example, the sources of noise are additive components to the square of the total noise, where the <em>Photon Shot</em> noise is a linear and the <em>PRNU</em> is a quadratic component (both) with respect to the signal:</p>
<pre>
[Total Noise]² = [PRNU Noise]² + [Photon Noise]² + [Read Noise]²
TotalNoise² = k⋅Signal² + h⋅Signal + ReadNoise²
</pre>
<p>However, there is not an explanation about how exactly this behavior arises from the camera sensor characteristics.</p>
<p>With the desire of getting a mathematical model explaining how and why the total noise has that given profile, we have used some known equations, describing properties of the statistical <em>Variance</em> and <em>Expected Value</em>, on a simple sensor model and we have found some simple formulas explaining as a whole the different noise components.</p>
<p>In this article we will develop that sensor model from the scratch, connecting camera sensor characteristics with the noise components in raw image files from that sensor.</p>
<p>If you you want to learn about the sources of noise in digital photography and you google that, you will find several interesting explanations about the <em>Read Noise</em>, <em>Photon Shot</em> noise and <em>PRNU</em> noise as components of the total raw image noise. </p>
<p>Those explanations say for example, the sources of noise are additive components to the square of the total noise, where the <em>Photon Shot</em> noise is a linear and the <em>PRNU</em> is a quadratic component (both) with respect to the signal:</p>
<pre>
[Total Noise]² = [PRNU Noise]² + [Photon Noise]² + [Read Noise]²
TotalNoise² = k⋅Signal² + h⋅Signal + ReadNoise²
</pre>
<p>However, there is not an explanation about how exactly this behavior arises from the camera sensor characteristics.</p>
<p>With the desire of getting a mathematical model explaining how and why the total noise has that given profile, we have used some known equations, describing properties of the statistical <em>Variance</em> and <em>Expected Value</em>, on a simple sensor model and we have found some simple formulas explaining as a whole the different noise components.</p>
<p>In this article we will develop that sensor model from the scratch, connecting camera sensor characteristics with the noise components in raw image files from that sensor.</p>
Last edited:
 <p>The post <em>"A Simple DSLR Camera Sensor Noise Model"</em> develops some formulas modeling the image raw pixel value and its noise from camera sensor data. However, those formulas are expressed as functions of lambda "λ", which is the <em>Expected Value</em> of the electron count in the sensor photosite. That makes seem those equations to belong only to the theoretical realm, to describe an abstract camera sensor, but not useful to model the noise in a particular concrete camera sensor.</p>
<p>This article fills that gap, showing a practical use for those formulas, in the <em>"Simple DSLR Camera Sensor Noise Model"</em> post, describing the Nikon D700 camera sensor behavior.</p>
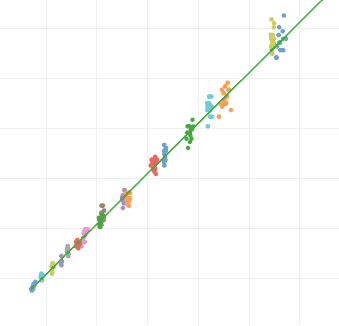
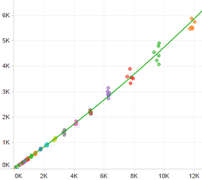
<p>We will see how to build a sensor noise profile, for any camera, from the <em>Variance</em> and <em>Average</em> pixel values in raw photos taken with that camera.</p>
<p>The post <em>"A Simple DSLR Camera Sensor Noise Model"</em> develops some formulas modeling the image raw pixel value and its noise from camera sensor data. However, those formulas are expressed as functions of lambda "λ", which is the <em>Expected Value</em> of the electron count in the sensor photosite. That makes seem those equations to belong only to the theoretical realm, to describe an abstract camera sensor, but not useful to model the noise in a particular concrete camera sensor.</p>
<p>This article fills that gap, showing a practical use for those formulas, in the <em>"Simple DSLR Camera Sensor Noise Model"</em> post, describing the Nikon D700 camera sensor behavior.</p>
<p>We will see how to build a sensor noise profile, for any camera, from the <em>Variance</em> and <em>Average</em> pixel values in raw photos taken with that camera.</p>
Last edited:
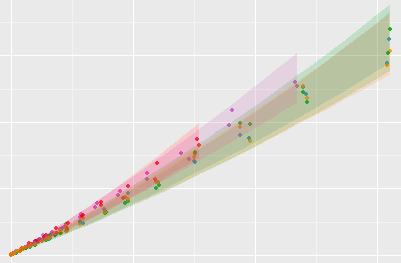
 <p>In the post <em>"Use of Linear Regressions to Model Camera Sensor Noise"</em> we need to fit two linear regressions. However, it turns out that fitting those regressions was not a trivial task: the data was <em>heteroscedastic</em> (with non constant variance) and required some analysis, transformation and cleaning.</p>
<p>This was a chance to learn and practice some techniques about linear regressions using the <em>R Language</em>. This article details all the steps, considerations and tools we used to fit a valid model over that heteroscedastic data.</p>
<p>In the post <em>"Use of Linear Regressions to Model Camera Sensor Noise"</em> we need to fit two linear regressions. However, it turns out that fitting those regressions was not a trivial task: the data was <em>heteroscedastic</em> (with non constant variance) and required some analysis, transformation and cleaning.</p>
<p>This was a chance to learn and practice some techniques about linear regressions using the <em>R Language</em>. This article details all the steps, considerations and tools we used to fit a valid model over that heteroscedastic data.</p>
Last edited:
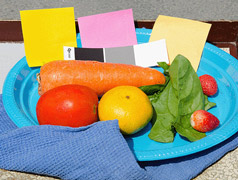
<p>We are going to develop a raw photo "by hand", instead of by using a software product. This way we will be able "demystify" the raw photo file matter, because one thing is to understand what it contains, but something even more instructive is to see what exactly is in there and process it, step by step by hand, doing what photo development software does behind the scenes to get the final image.</p>
<p>We will have the perfect context to learn about —and use— many concepts required for digital photography, as <em>Gamma Correction</em>, <em>Color Model</em>, <em>Color Space</em>, <em>Chromaticity</em>, <em>Color Correlated Temperature</em> and many others. These concepts are described in a simple way, oriented to anyone who wants to understand them starting from scratch, resulting very useful and illustrative to beginners in the world of digital photography.</p>
<p>Summarizing, this exercise will help us to:</p>
<ul>
<li>Take a glimpse of what the development software must deal with.</li>
<li>Have a hands-on experience with raw files and the many topics around it.</li>
<li>Have a way to get what really your camera produces without the effects of what your developing software introduces.</li>
</ul>
<p>This is the part 1 of this wiki series.</p>
Last edited:
 <p>This is the Part 2 of the wiki <em>Developing a RAW photo by hand</em>.</p>
<p>In this part we will learn how to process the raw image file data to get the final image.</p>
<p>We will use many <em>Color Matrices</em> transforming the RGB coordinates from the camera raw space all the way up to the <em>sRGB</em> color space. In the way from one color space to the other, we will get the image color pixels in other color spaces as in CIE XYZ with CIE illuminant D50 and we will transform them to XYZ but with illuminant D65.</p>
<p>We will also process the image using DxO Mark color matrices. Furthermore, we will use those matrices embedded in the DNG (<em>Adobe Digital Negative</em>) file format. We will get the DNG file from the conversion of the original Nikon ".nef" file to the ".dng" format.</p>
<p>This is the Part 2 of the wiki <em>Developing a RAW photo by hand</em>.</p>
<p>In this part we will learn how to process the raw image file data to get the final image.</p>
<p>We will use many <em>Color Matrices</em> transforming the RGB coordinates from the camera raw space all the way up to the <em>sRGB</em> color space. In the way from one color space to the other, we will get the image color pixels in other color spaces as in CIE XYZ with CIE illuminant D50 and we will transform them to XYZ but with illuminant D65.</p>
<p>We will also process the image using DxO Mark color matrices. Furthermore, we will use those matrices embedded in the DNG (<em>Adobe Digital Negative</em>) file format. We will get the DNG file from the conversion of the original Nikon ".nef" file to the ".dng" format.</p>
Last edited: