[[!meta Error: cannot parse date/time: ]] [[!meta Error: cannot parse date/time: ]]

When you have a RGB image, you can easily compute statistics for each of the image channels, as their average or variance values. The question is How we can merge those values to get those statistics with respect to the whole image and not just each single channels? We will also see how Adobe Photoshop make these calculations, the pros and cons of the different formulas they use for the two possible modes it has to compute them: "RGB" and "Luminosity".
If you are reading this article from the data-analysis angle (as a "datactive") and you can't resist a challenge to your skills, here you will find an interesting one.
As we don't completely like any of the two PS formulas for the Variance we propose an alternative one.
The Question
We want to measure the noise in a RGB image. We know that a key indicator of the noise in a image is its SNR (signal to noise ratio), which is computed as the average color value of the pixels in a plain patch target divided by the standard deviation (noise) of the color values of those pixels. For each of the three image RGB channels we can easily compute the average and noise to get the SNR, but this way we end up with three averages, standard deviation, and SNR values: One set of those values for each channel.
The question is how can we get a noise measurements representative of the whole image? This means to solve questions as: how can we get the average and the standard deviation and the resulting SNR representative of the entire image? In other words, we want to know how to merge the three channels averages, standard deviations and SNRs to get only one set of those values representative of the entire image. What follows is a better context description, then we will explore some solutions.
We have a color image represented in the RGB color model, this means we have an image composed by color pixels, where each pixel has three numeric attributes representing the intensity (or luminosity) of the red, green and blue primaries, whose mix renders the corresponding pixel color.
We can think about that RGB image, like composed by three monochromatic images with the same dimensions as the color image. One with the red value of each pixel in the color image pixel (the red channel), another with the green (the green channel) and another one with the blue values (the blue channel).

In each color channel we can add the pixel values and compute the Average and the Standard Deviation without any problem. It is easy to understand the average of the green pixel values is the image average green value, which means the average intensity of the green color component in the image. However, if we average green pixel values together with the red and blue pixel values, what would that value represent? It sounds like comparing apples and oranges.
Looking for the whole image average, one would expect that value to be perceptually correlated with the image luminosity. After all, the pixel values are encoding red, green and blue (RGB) luminosity, right? Once the RGB pixel values are converted to their luminosity equivalent value, we will be ready to compute whatever we want for the whole image data and get statistics values representative of it.
What we are saying here is like we would have three amounts of money —each one with a different currency— and we wanted the total amount. To be able to sum those amounts we need first to convert them to a common currency or unit of measure. In the case of RGB pixels, that common unit of measure is the relative luminosity.
The relative color luminosity is not just an abstract concept. It has been measured and standardized by the CIE as a function of "each" pure color wavelength: the luminosity function. The luminosity is such a useful information that the CIE XYZ color space describe the colors with X, Y an Z coordinates, where the Y coordinate is the color relative luminosity. For example, if green and blue light are emitted with the same intensity (technically speaking), we perceive the green light as more luminous than the blue one.
If the intent is not to compute statistics portraying the image luminosity, another kind of conversion would be used. In our particular case, we want to measure the image noise through the Standard Deviation of the pixel values, and the perception of the noise is clearly related with changes in the image luminosity. Therefore, the conversion of the pixel component values to their relative luminosity perfectly fits our needs.
The Answers
The pixel RGB color components can be linear (e.g. before Gamma Correction) or non-linear (after a tonal correction, e.g. after Gamma Correction). For example, the ubiquitous sRGB color space includes a Gamma Correction. Accordingly, the "final" sRGB color components are nonlinear.
Technically speaking, the real luminosity must be computed from the linear RGB color components. Because of that, if we compute a value, analogous to the luminosity, but calculated from the non-linear color components, it is not correct to name luminosity to that value, instead, it is called "luma" and is represented by the symbol Y' (in reference to the Y component in the XYZ color space).
The NTSC RGB is a particular RGB color space, with a standard (Rec. 601) stating since 1982, how to compute the "luma" from the NTSC RGB color component values. NTSC is an acronym that stands for "National Television System Committee" and is also the name of their standard for the transmission of analog television. As you might guess, they have very well known standards from before the Internet era.
The following formulas show how the luminosity and the luma must be computed according to NTSC (Rec. 601). In these formulas, Y stands for luminosity (or luminance) and Y′ stands for luma. Correspondingly, Red, Green and Blue are the linear RGB color component, while the corresponding primed terms represent the nonlinear RGB color components.
#-----------------#
# NTSC (Rec. 601) #
#-----------------#
  Y  = 0.299⋅Red  + 0.587⋅Green  + 0.114⋅Blue
  Y′ = 0.299⋅Red′ + 0.587⋅Green′ + 0.114⋅Blue′
The RGB color components in these formulas, should be in the NTSC RGB color space. However, very often, these formulas have being applied directly to color components in other color spaces, as a kind of a "standard" luminosity and luma.
The coefficients in those formulas come from the Y component corresponding to the RGB primaries (Yred, Ygreen, Yblue) defining the color space. These coefficients are those Y values normalized to get their sum equal to 1. We can get those Y values, for many RGB color spaces, from this page in Bruce Lindbloom web site. In particular we can find for the sRGB and Adobe color spaces:
#------------------------------#
# For sRGB (and NTSC Rec. 709) #
#------------------------------#
  Y′ = 0.2126⋅Red′ + 0.7152⋅Green′ + 0.0722⋅Blue′

#----------------------#
# For Adobe RGB (1998) #
#----------------------#
  Y′ = 0.2974⋅Red′ + 0.6273⋅Green′ + 0.0753⋅Blue′
In the NTSC Rec. 709 standard, in accordance to a change in their primaries, the luma is computed as in the above formula. It should be obvious that the formula for the luminosity uses the same coefficients but multiplying the non-linear RGB color components: the same equation but without the prime symbol. For now on, we won't use the prime symbols for the RGB color components, it is implicit that if we are computing luminosity they are linear and if we are computing luma they are nonlinear.
In general terms, we can say the luminosity and the luma can be computed as a weighted sum of the RGB color components:
Y = Cr⋅red + Cg⋅green + Cb⋅blue
Where Cr, Cg and Cb are the coefficients corresponding to the color space where the color components (red, greenand blue) are.
The luma Average
To get the average luma, we apply the Expected Value operator to both ends of the above equation (the Expected value is estimated through the average value), to get:
  Eva(Y′) = Cr⋅Eva(Red) + Cg⋅Eva(Green) + Cb⋅Eva(Blue)
  avgLuma = Cr⋅avgRed + Cg⋅avgGreen + Cb⋅avgBlue
The above formula tells we can easily compute the average luma as a weighted sum of the channels averages.
We must have in mind that the RGB model is an additive color model, but that addition occurs as a human perception process. Even when there is not a real physical or mathematical addition of elements, that is the model that best depicts the way that the human vision behaves.
This model has been measured by the CIE, and the Cr, Cg and Cb coefficients are derived from that model, which in turn was built on the experimental data measuring average human vision perception. Therefore, those coefficients really match the average human eye perception.
Using Adobe Photoshop (PS), for a RGB image, we can get the whole image mean (average) and standard deviation in two modes: RGB and Luminosity. In the channel menu, there is also a Colors option, but it shows the same values for the mean and standard deviation as the RGB mode, they just display the histogram with different colors.

Using Adobe Photoshop we can get the entire image mean and standard deviation (green frame) in RGB or Luminosity mode (blue frames).
The PS RGB entire image average value is computed with the following formula:
AvgRGB = (1/3)⋅(AvgRed + AvgGreen + AvgBlue)
This formula computes the entire image average as the plain average of the red, green and blue average channel values, adding the RGB color components without any "unit transformation", for our needs, like adding apples with oranges. This average value is useless if you want a value portraying the perceived image average luminosity. Using this formula the patches in the following image have the same average value, even when clearly the green patch (r:80, g:240, b:80) appears to have more brightness than the blue patch (r:80, g:80, b:240).

This two patches has the same PS RGB mean.
The PS Luminosity mean value —for the whole image— is computed using the following formula (very approximately):
AvgLuma = 0.30⋅AvgRed + 0.59⋅AvgGreen + 0.11⋅AvgBlue
As we saw before, this formula roughly corresponds to the NTSC Rec.601 standard. However, PS uses this formula regardless the RGB color space of the image profile. You can check this using the menu command "Edit » Assign profile" to change the image color space, for example from sRGB to Adobe RGB. With this command the image RGB color component values remain unchanged, but their meaning (the mapping from the values to the color) change because they are moved to another color space, you can see that in the displayed image. However, the mean and the standard deviation remain unchanged after the change of color space.
The luma Standard Deviation
The standard deviation is the square root of the variance, so we need first to compute the luma variance in order to be able to get the luma standard deviation. If we apply the Variance operator to both ends of the luma formula above, we get the following formula for the luma Variance.
  Var(Y′) = Var(Cr⋅red) + Var(Cg⋅green) + Var(Cb⋅blue)
            + 2⋅Cov(Cr⋅red, Cg⋅green) + 2⋅Cov(Cr⋅red, Cb⋅blue) + 2⋅Cov(Cg⋅green, Cb⋅blue)

  Var(Y′) = Cr²⋅Var(red) + Cg²⋅Var(green) + Cb²⋅Var(blue)
            + 2⋅Cr⋅Cg⋅Cov(red, green) + 2⋅Cr⋅Cb⋅Cov(red, blue) + 2⋅Cg⋅Cb⋅Cov(green, blue)
The first line, of the above formula, tells we can easily compute the luma Variance —once again— as a weighted sum of the channels Variances. The second line requires the Covariance of each possible pair of RGB values. As the covariance is commutative, the parameter order is meaningless.
The Covariance calculation is not complicated but can be computation expensive. We can compute it as the Expected Value of the product of the pixel values minus the product of their Expected Values. We estimate the Expected Value with the mean value:

Evaluation of the Covariance from Expected values.
As we can see, computing the mean of the product of pixel values is the expensive part. We would love to be able to get the luma Variance just from the Average and Variance values from each channel. One option we have, avoiding the Covariance calculation, would be the truncation of the Covariance part in the equation above.
Another option would be to get a rough covariance estimation based only on the Average and Variance values from each channel. There are many papers about the estimation of Covariance, but they are out of our understanding or involves computation on sampled data, i.e., not based only on the Average and Variance values.
The Challenge
To get an idea about how to compute the whole image Variance, lets recall Photoshop© shows, under the pixel values histogram, the Average and the Standard Deviation for both, the whole image (or selected area) and for the individual RGB channels. Now the question is How does Photoshop computes the whole image Average and Standard Deviation?
Photoshop provides those statistics in two flavors: "RGB" and "Luminosity". In other words you can get the image Average and Standard Deviation calculated in RGB and in Luminosity mode. There is also a Colors option, but it produces the same values as RGB.
Those values are calculated just using the Average and Standard Deviation from each channel. We don't have a problem with respect to how to compute the image average, we think the above "luma" average is fine for our needs. We need a hint with respect to how to handle the Covariances in the above formula for the luma Variance (Var(Y′)).
To find the Photoshop formula used to calculate the image Average and Standard Deviation we can think on this process as a "black box", where you throw in the Standard Deviation and Average values from each of the three image RGB channels (6 values) and the box throws you out a "synthetic" Standard Deviation and Average for the whole image.
If you like the data analysis challenges, here you have a good one! Now we need observations with the required variety of the input values together with the Photoshop output values. This way, through the study of that data, in my case using R Language, we can infer what equations connect the input values with the output ones, clearly we are talking about linear regressions here.
We have already sampled the data and using this link you can download what we got (5 KB). This data has enough variety to get the formulas we are looking for.
This data contains three types of columns, with names ending with:
- Avg: The average value.
- StdDev: The Standard Deviation.
- Var: The Variance (just the square of the StdDev).
We have four sets of columns with the previous triplets, their names begin with:
- lum: The Photoshop output when the statistics are calculated in luminosity mode.
- rgb: The Photoshop output when the statistics are calculated in RGB mode.
- r: The red channel input information.
- g: The green channel input information.
- b: The blue channel input information.
If you want to take the challenge, don't let me spoil your analysis and stop reading the following lines. Take the data and try to figure out the connection between input and output values. My resulting formulas are lines below, they are "hidden" to avoid you accidentally read them in case you want to take the challenge.
Photoshop Average and Standard Deviation Formulas
Through the analysis of the data provided in the above link, we have got the formulas shown in the following sections.
Photoshop formulas in RGB mode
These are the formulas used by default in Photoshop.
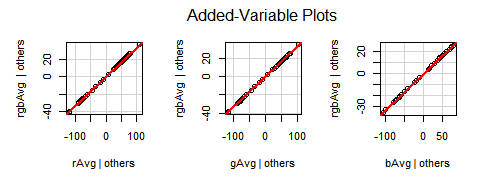
Photoshop RGB Average
Formula for the RGB Average:
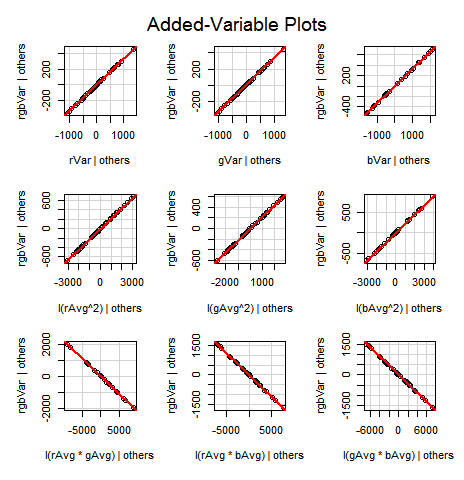
Photoshop RGB Variance
Formula for the RGB Variance (RGB StdDev²):
Photoshop formulas in Luminosity mode
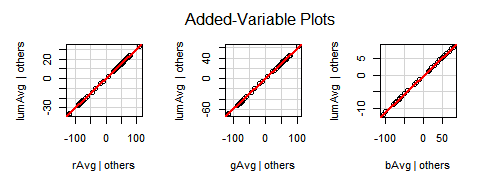
Photoshop Luminosity Average
Formula for the Luminosity Average:
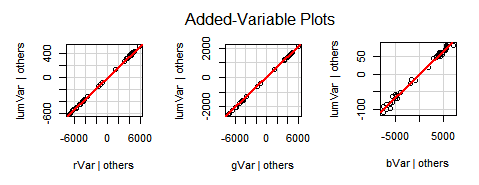
Photoshop Luminosity Variance
Formula for the Luminosity Variance (Luminosity StdDev²):
Final thoughts
In a work about image noise, we have already used the PS Luminosity Variance formula shown above. At that time, we didn't have any PS variance formula. We found the luminosity variance formula just deriving it from the luma average —as we did in the first part of this article— and disregarding the covariances. Using that formula we got very low variances. They were so low with respect to what we would expected, that we even double check the numbers and formulas looking for some mistake, but there wasn't any.
The Luminosity Variance formula brings —in general— smaller values than the RGB Variance one, and in some cases very much smaller. In the following graph we can see a plot of the Standard Deviations (the squared root of the variance) obtained with both formulas, most of these observations come from the same data used to find the PS formulas. We are not claiming this sample is "statistically fair" to make this comparison, but it gives a clue about what we are talking about.
> plot(ps$lumStdDev, ps$rgbStdDev, xaxs="i", yaxs="i", xlim=c(0, 120), ylim=c(0,120), xlab="Luma Standard Deviation", ylab="RGB Standard Deviation", col="darkgray", bg="gray25", pch=21, main="RGB vs Luma Standard Deviation")
> abline(0,1)
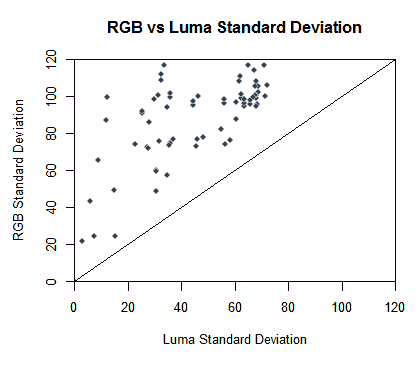
As we can see, all the RGB Standard Deviations are greater than their corresponding Luminosity Standard Deviation (above the line y=x). The points in the top left area corresponds to big RGB Standard Deviations with a very small Luminosity Standard Deviation value. To understand why this happens, lets assume we compute the average giving equal weight to every channel (as in the PS RGB Average) and we derive the Variance from that average, disregarding the Covariances (as in the PS Luminosity Variance). We will refer to those values as WholeAvg and WholeVar:
WholeAvg = (AvgRed + AvgGreen + AvgBlue)/3 WholeVar = (VarRed + VarGreen + VarBlue)/9
This seems correct, and ignoring the channel weighting this is how the Luminosity Variances works. Now, lets suppose the channel variances are in the [0%, 100%] range (or in [0,1] if you prefer). If the three channels would have the highest possible variance (100%) we would expect the whole image variance also to have the highest possible value, but look what happens:
WholeVar = (100% + 100% + 100%)/9 WholeVar = 100%/3 = 33.33% WholeStdDev = 100%/sqrt(3) = 57.7%
This is the reason why the PS Luminosity Variance formula brings undervalued variances. Probably they (the Adobe company) keep this formula only for backward compatibility reasons.
We get more "fair" results if the whole variance (WholeVar) is calculated by just averaging the channel variances:
FairWholeVar = (VarRed + VarGreen + VarBlue)/3 FairWholeVar = (100% + 100% + 100%)/3 FairWholeVar = 100% FairWholeStdDev = 100%
This is exactly what the first part of the PS RGB Variance formula uses. That formula, even takes a step forward with the inclusion of a rough covariance term.
If the image pixel color values would be in the [0, 1] range, an image with half of the pixels black and half of the pixels white, would have each channel with the maximum possible variance. We would expect for the whole image also the maximum possible variance, in this example 0.25. Furthermore, in this context, each channel variance would be 0.25 and each channel average would be 0.50. Lets see the result from the PS RGB Variance formula:
  VarRGB = + (1/3)⋅(VarRed + VarGreen + VarBlue)
           + (2/9)⋅(AvgRed² + AvgGreen² + AvgBlue²)
           - (2/9)⋅(AvgRed⋅AvgGreen + AvgRed⋅AvgBlue + AvgGreen⋅AvgBlue)
VarRGB = + (1/3)⋅(0.25 + 0.25 + 0.25)
+ (2/9)⋅(0.5² + 0.5² + 0.5²)
- (2/9)⋅(0.5⋅0.5 + 0.5⋅0.5 + 0.5⋅0.5)
VarRGB = + 0.25
+ 1/6
- 1/6
VarRGB = 0.25
Indeed, with the PS RGB Variance formula we get for the whole image variance —as expected— the maximum possible value.
A proposal for the Variance formula
For all what we have already said, we would prefer the RGB formulas rather than the Luminosity ones. However, the RGB formulas weight equally every channel, and that is something we don't like. We would like to blend the luma weights with the RGB formulas. In that sense, we propose:
  Avg = 0.299⋅AvgRed + 0.587⋅AvgGreen + 0.114⋅AvgBlue

  OdLVar = + 0.299⋅VarRed + 0.587⋅VarGreen + 0.114⋅VarBlue
           + (2/3)⋅(0.299⋅AvgRed² + 0.587⋅AvgGreen² + 0.114⋅AvgBlue²)
           - (2/3)⋅(0.486⋅AvgRed⋅AvgGreen + 0.214⋅AvgRed⋅AvgBlue + 0.300⋅AvgGreen⋅AvgBlue)
The average is just the plain and simple Luminosity —weighted— average. The proposed Variance formula (OdlVar) uses those luma weight but without squaring them. As we saw above, squaring them leads to undervalued results.
On each line of the OdlVar formula, the sum of the coefficients gives the same result as in the PS RGB Variance. In the second line of the OdlVar, the squared channel averages, with the "same role" as the channel variances, are also correspondingly luma-weighted. In the third line, the square root of the product of the corresponding luma weights, normalized to sum 1, are used for the corresponding average products.
I have not tested yet this formula in a practical "real life" case, this what at first glance seems correct to adapt the PS equal weighting channel formula to a luma weighted one.