In the first part of this wiki we have learn a bit about the digital camera sensors, how to extract the image color data from the camera raw file and we did a first (wrongly) attempt to get a sRGB from the raw file. Even after learning and applying "White Balance" and "Gamma correction" we didn't get a good sRGB image. To understand why our result is not good we introduced many digital photography concepts and now we are ready to understand what went wrong in our first development attempt.
Building Correctly our RGB Image
Now we can explain clearly why our first development try was wrong. First we have to state, we chose to build the image in the sRGB space because, without the required tags in the image file —which we are not putting on it—, most applications will assume the image pixel values (RGB coordinates) are in the sRGB space, and by making this correct, they will display it correctly.
We took the color RGB values from the raw file and put them directly in the sRGB image just after a previous gamma correction. However, the color coordinates from the raw file are in the camera raw color space, that is a RGB space which is defined by the chromaticities of its primary colors, in this case by the chromaticities for which the photosites are color sensitive, and this RGB color space is —surely— not the sRGB space, which has another primaries. So we need first to transform the colors from the camera raw space to the sRGB one before to put them in the image file.
How to Transform Camera raw RGB values to sRGB values?
The simplest way to transform camera raw RGB values to another RGB space as sRGB is through the use of a color matrix formula like those we introduced above see here.

Formula to convert camera raw values to sRGB. M is a matrix and sRGB y RGBraw are vectors with the RGB color components.
At the right end of the equation we have as input, the RGB components from the camera raw channels (RGBraw), we have that data from the raw photo file. At the left end of the formula is the result, the RGB color components in the sRGB space.
Now the question is, how do we get the Color Matrix M? Well, there are different ways. In the same sense we put in the scene a card (behind the carrot) with calibrated neutral colors (dark gray, medium gray and white patches on a QPCard), we would place a Color Chart, with calibrated colors and with some math we could calculate the color matrix.
The color charts have colors with known color coordinates, the color chart vendor provides the color coordinates of the colors in the chart. Once we have the color coordinates in any absolute color space, we can convert them to any other color space. For example, the Bruce Lindbloom's web site has this calculator to convert color coordinates from one color model to many others, there is also information about how to do that by yourself. In particular, we can convert them to sRGB, so we can have the sRGB color components of the color patches in the chart. Which means, we have the values at the left end of the equation above. If we took a picture of the color chart, we would have the camera raw RGB values (Rraw, Graw, Braw) at the right side of the equations, in other words, we would have as many sets of the following equations as patches in our color chart:

At the left side we have the known sRGB color values of the patch and at the right the RGB raw values from the raw photo of the color chart.
For each patch in the color chart, at the left side of the equations, we have the known sRGB color components of the patch and at the right side we have the RGB raw color components (Rraw, Graw, Braw) from the patch in the raw photo of the color chart. The only variables are the 9 color matrix components. Moreover, if the chart has —for example— 24 patches, we would have 24 sets of this equations and only 9 variables! For that reason, we would do what is known as a linear regression, finding the color matrix that best fit the equations.
The issue here is, there is not a "universal" color matrix for each camera model! That is because the matrix depends on the illuminant under which the photo of the color chart was taken! In other words, the raw RGB values we would read from the color patches in the photo, will vary —for example— between a photo taken outdoor and a photo taken indoor under artificial light. In fact, even photos taken all at daylight outdoor will vary, having technically a different illuminant, depending on the state of the sky (overcast, clear, cloudy, etc.), bringing different raw RGB values (Rraw, Graw, Braw) at the equations above, leading to different color matrices.
What is the solution? Well, if you know how to manage, to get and use the color matrix from the equation above, you could take a shot of the color chart before a photo session with a given light environment —or illuminant— and later process the photos with the color matrix obtained from the color chart photo. Notice how this is something we can achieve only by taking raw photos, that gives us a complete new world of opportunities and possibilities than with non-raw image files.
For example, RawTherapee is a great raw photo processor and image editing tool that allows us the use of our own color matrix. However, if you don't use a tool accepting directly a color matrix, you can easily build a DCP color profile from it.
At this moment of our exercise, it is too cumbersome the build and use our own color matrix, based on a photo of a color chart. Above that, it is also too late, we should have taken the photo to the color chart at the moment we took the photo —with the same illuminant— we are working on.
Another usual solution regarding to color matrices, is to have two color matrices, one built based on one illuminant and the other based on another "very" different illuminant, so we can interpolate between those matrices and derive the one for the actual illuminant in our photo.
Using Color Matrices from DxO Mark
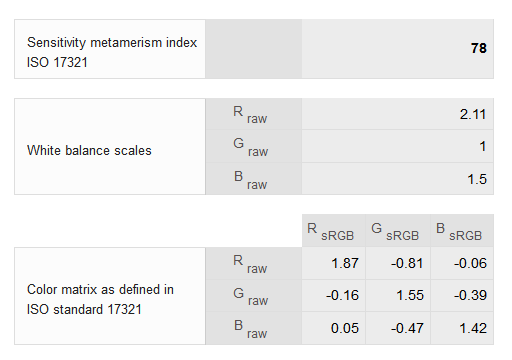
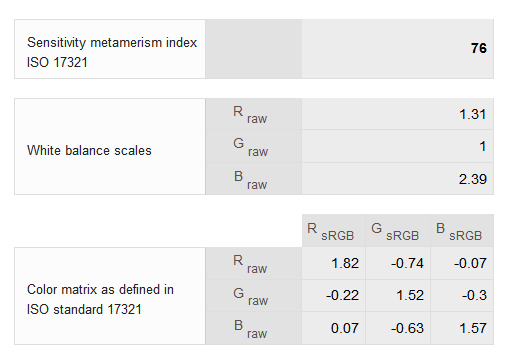
One source for that kind of information is DxOMark. If we look on their site for the color response of the Nikon D7000, which is the camera used to take the photo we are processing, we will find those two matrices, one for the CIE Illuminant A and another for the CIE illuminant D50.
For each matrix we also have the corresponding metamerism index, which is an indicator of how well the matrix can transform the colors from a raw photo of the camera under the given illuminant. For this index, the perfect score is 100, which is never achieved. That score corresponds to a camera which can "see" the colors as we the humans do.
To have a relative idea about what a good value for this metamerism index is, lets take a look to the camera with the best performance in color depth (now, april-2014) according to DxO Mark ranking: it is the Phase One IQ180 Digital Back, with a price reference value of US$42,500.00 (yes, very cheap!). This camera has a metamerism index of 80 for the illuminant D50 and 77 for the CIE Illuminant A. Now we can see how the Nikon D7000 corresponding metamerism indices of 78 and 76 are not bad at all!
Also we can see in the information, how it is decoupled the different relative sensitivities among the RGB photosites from the color matrix itself. In the color matrix, the sum of each row scales is 1. This way, neutral white-balanced RGBraw values produce neutral sRGB values (R = G = B).
The different relative sensitivities among the RGB photosites, also vary with the illuminant, as expected. As a reference, the Phase One IQ180 Digital Back has RGB sensitivities —under the illuminant D50— of (1.46, 1, 1.98) not very far from (2.11, 1, 1.5) in the case of Nikon D7000.
OK, now we have the two aforementioned matrices. How do we interpolate them to get the one corresponding to the illuminant used to take the photo we are developing? We will do that interpolation later, when we have the required information at hand, we can do that starting with the DxOMark information we have now, but that process at this point is out of our scope. However, we will manage to use this information in a useful way.
For the moment, let's consider the illuminant D50 characterizes "direct sunlight", and our photo was taken exactly that way, so let's use directly the D50 matrix and let's see what we get. However, we will build the White Balance scales from the white patch in our photo, and also we will use the channels with the pinkish highlight issue corrected (raw_phc_r, raw_phc_g, raw_phc_b).
Our raw channels have as maximum values (8141, 15762, 11266), which means the maximum scale that can be applied over them, without breaking the raw upper limit of 16383 ADU, is 16383/(8141, 15762, 11266) = (2.0124, 1.0394, 1.4542). Also, in those channels, the white patch —in the card behind the carrot— has RGB mean values of (7549, 14596, 10465) ADU, which brings as white balance scales 14596/(7549, 14596, 10465) == (1.9335, 1.0000, 1.3947). As we can see, none of these factors are greater than the corresponding maximum scale we found before, so we can directly use them in the processing of our image.
In the way we actually have the color matrix, we have first to multiply the raw RGB values by the raw White Balance scales, and then we can multiply that result by the color matrix to get sRGB values.
To simplify the things a little, we will apply the raw White Balance factors to the color matrix components, so we can use it directly on the raw RGB values. For example, we will convert the first row in the matrix this way (1.87, -0.81, -0.06)×(1.9335, 1.0000, 1.3947) == (1.87×1.9335, -0.81×1, -0.06×1.3947) == (3.6156, -0.8100, -0.0837). Doing this to the whole matrix we get:
   3.6156   -0.8100   -0.0837
  -0.3094    1.5500   -0.5439
   0.0967   -0.4700    1.9805
To apply the color matrix to our input raw channels, we will use the ImageJ colorMatrix script. In this script we will use 2.2 for the gamma correction. Be aware ImageJ doesn't show the result using the sRGB color space.
If we save the picture from ImageJ and open it with any other application, it is possible we still won't see it in the sRGB space. The problem is it has not embedded a color profile specifying it is in that space. So, many applications will show it in the sRGB space as default, but some ones will show it in the color space associated to your computer monitor.
To be sure we will see it in the sRGB space, we must open it with a color managed application, like Rawtherapee, Adobe Photoshop or Adobe Lightroom and chose sRGB as input profile if required and save it with the sRGB output profile. That will just embed the sRGB profile in the picture.
In the following picture, we show the result right after the processing with the colorMatrix script using the color matrix above, there you can see the same image, with and without the sRGB profile embedded.
Many color-managed applications, in the absence of an embedded color profile in the second image, will show it in the sRGB space as default, in such case both images will look exactly the same. Some other color-managed applications will show the second image in your display profile (for example Google Chrome V34 and Firefox V29 on Windows 7), making it look slightly different depending on how far from the sRGB space your display is. On my LCD monitor, the tomato in the second image looks less reddish than in the first one.
Non color-managed applications will ignore the sRGB profile embedded in the first picture, causing both images look the same.
This result is, by far, very much better than the one in our wrongly first try. This result shows how important to have a good input profile is, even if it is just a simple matrix. In strict technical sense, this matrix is not an input profile, but conceptually, it is. This matrix must be contained in a file with a formal structure of a color profile to call it an input profile, but in both cases we will get similar results. However, as we will see later, an input profile can contain a lot more of information to process an image.
A Matrix Interpolated from the DxO mark Ones
In the previous try, we have used the DxO Mark D50 matrix with White Balance factors calculated from the white patch in the raw image. What if we White-Balance the image using both, the gray and the white patches? and what if in the process we interpolate the two DxO Mark matrices? Let's do that!
We will build in a Excel spreadsheet, a matrix interpolated between the two DxO Mark matrices. This interpolated matrix will be a function of a given CCT. The DxO Mark matrices with illuminants CIE A and D50 have a CCT of 2,856°K and 5,003°K correspondingly. If the interpolation is well done, setting the CTT of the interpolated matrix to 2,856°K or to 5,003°K should bring —correspondingly— the CIE A or CIE D50 DxO Mark color matrix.
However ,the interpolation must be calculated with the reciprocal value of the CCT associated to the matrix. This is because the matrices are more uniformly distributed with the reciprocal of the temperature than with temperature itself. The reciprocal of °K multiplied by 1M is called mired. This way, the CIE A matrix corresponds to 350.1 mired and the CIE D50 one corresponds to 199.9 mired.
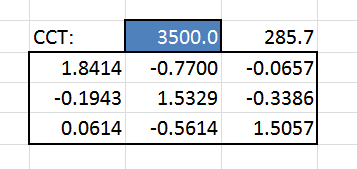
This is the matrix interpolating the DxO matrices at given CCT (.g. 3500°K). However the interpolation is calculate with the reciprocal value (e.g. 285.7 mired).
The blue cell is the CCT variable we need to find. At its right is corresponding reciprocal in mired unit, which is a function of the CCT and is the value used to interpolate the two given matrices.
On the other hand, we have the mean RGB camera raw values corresponding to the gray and white patches in the image. We will build a mathematical model where this raw values are transformed to the sRGB space using the interpolated matrix and two raw White Balance factors, one for the red raw and other for the blue raw values. This way we have three variables (unknowns) in the model: the CCT of the interpolated matrix and the red and blue White Balance scales. The output of the model is the white balance factors and the interpolated matrix to be used in the building of our sRGB image.
Notice that to balance the relationship between three RGB color components, we just have to 'move' two of them —as we do by scaling independently the red and blue components— and not the three components at the same time.
This is because we can affect the third 'not moving' component by just changing the other two ones. For example, if the green component should be relatively larger, we just reduce both, the red and blue components by the same factor.
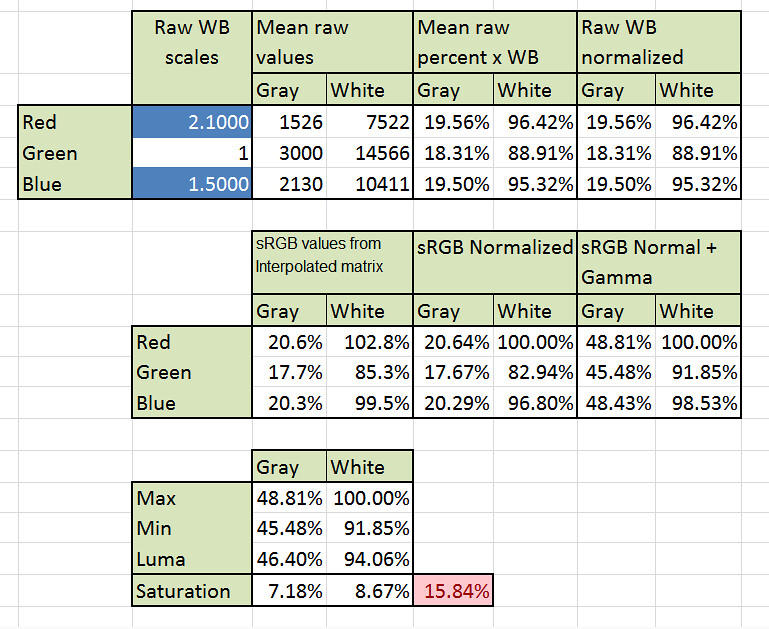
Lets see the model with more detail in the following image.
We start (at the top left side of the picture above) with the two other variables we want to find, the red and blue raw White Balance factors in the blue cells. Then we have the mean raw RGB values from the gray and white patches in the image. At their right (under the title "Mean raw percent x WB") we have those values as a percentage of the maximum raw value (16383) and scaled by the White Balance factors, then we have under the title "Raw WB normalized" the same previous values but normalized in a way that none of them is above of 100% (dividing all the values for the maximum of them when that maximum is above 100%).
In the second row of the picture, we multiply the interpolated matrix by the normalized raw RGB values to get the gray and white patch RGB values in the sRGB space, then we normalize these values as we did before, to keep them always not above 100%. We end the row with the previous normalized sRGB values but this time also Gamma Corrected.
Finally, in the third row we find the minimum and maximum RGB component values and the patch "luminosity", where the luminosity is approximated with formula:
Luma = 0.2126 * Red + 0.7152 * Green + 0.0722 * Blue
The color saturation of each patch is calculated by dividing the difference between maximum and minimum values by the patch "luminosity". Ideally, the gray and white patch should have zero saturation, so we want the minimization of the sum of both saturations, in the red cell.
We will use the Solver add-in in Excel, with the target of minimize the sum of color saturation of the gray plus white patches while having as variables the CCT of the interpolated matrix and the raw White Balance scales. As starting point we will use 5,003°K for the interpolated matrix and as raw White Balance scales (1.9335, 1, 1.3947), which are the same values we used in the building of our previous image in sRGB.
As restrictions, the resulting sRGB components must not be negative, each raw White Balance factors must be in the range [2.4, 0.4] and the CCT of the interpolated matrix must be in the range [2500, 6000] °K. I have chosen this restriction based on common sense and having as reference the data associated to the DxO Mark matrices.
Using the "Evolutionary" resolution method to get a global minimum (according to Excel documentation) we get 2,500°K (the lower end in the CCT restriction range!) and White Balance scales of (1.9392, 1, 1.3889). This is not what we expected at all, because the light was not as reddish as the corresponding to 2500°K. The resulting color matrix with the White Balance scales embedded in it is:
 3.49713    -0.71677    -0.10183
-0.46523     1.51005    -0.37519
 0.14861    -0.68309     2.24972
The target value has not changed very much, it started from 1.49%, a very low value because in the previous try we White-Balanced perfectly the white patch: the raw WB scales were calculated to neutralize this patch (Saturation = 0). As consequence the sum of saturations, at the beginning contains only the gray patch saturation which is just 1.49%.
After the optimization the sum of saturations decrease to 1.45% (0.78% and 0.67% for the gray and white patches). Judging based only in the decreasing of the target value, it doesn't seem a great change. The White Balance scales wasn't also changed to much, from (1.9335, 1, 1.3947) to just (1.9392, 1, 1.3889) requiring a little more presence of red. However, looking how the CCT has gone from 5003°K to 2500°K reveals a change not so subtle anymore, and we will see that in the resulting image.
Using the colorMatrix script in ImageJ we build the image shown in the following picture. Remember, the image must have embedded the sRGB profile to get more chances to see it —really— in sRGB space, as we do in all our resulting images.


The 'Before (left)' image is the result using the D50 matrix. The 'After (right)' image is the resulting of the minimization of the saturation in gray and white patches. Now the red tones are richer. Please compare the tomato before and now.
Without doubt the image looks much better now, in particular the colors with a strong presence of red. The tomato and carrot surfaces have a more deep and even color. The yellow and orange post-its —in the background— have a more intense color and closer to what they really look.
Using Color Matrices from Adobe DNG
A wealth source of information for raw photo processing is embedded in ".dng" files. DNG stands for Digital Negative and is an Adobe initiative for the standardization of a common raw file format. Some camera brands have already adopted the format, as Hasselblad, Ricoh, Leica and Pentax to name a few. However, the largest camera manufacturers as Nikon and Canon have never indicated an intention to use DNG. Nonetheless, you can convert raw files from almost any camera brand —including Nikon and Canon— to the DNG format by using the Adobe DNG Converter, which is a free application.
To be able to view the metadata embedded in a image file, as we will need to do from the DNG file, we need a tool. There are many options, but the best of them is ExifTool by Phil Harvey, which is also free. ExifTool, by itself, is intended to be used through a command line interface, which is not as easy to use as through a GUI interface. Fortunately, we can use ExifTool through a GUI interface by using ExifToolGUI for Windows as we will do in the following steps.
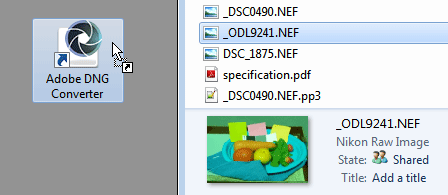
The easiest way to convert an image to the DNG format is just dropping the image on the DNG Converter shortcut, as shown in the picture above. The converter window will open up and you will have the chance to set some options, as where do you want to get the resulting image file. By default, it will save it in the same folder where the original image is located.
Once we have the DNG version of the raw image file, we can open it with ExifToolGui. The ExifToolGui right panel shows the metadata in the DNG file. To see all the metadata available press the "ALL" button above that panel.
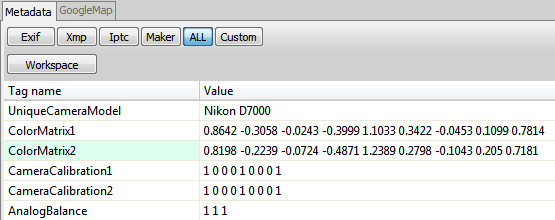
After converting the Nikon ".nef" image file to the DNG format, we use ExifToolGui to read the IFD0 section to get the following information:
CalibrationIlluminant1: CIE A

CalibrationIlluminant2: CIE D65

ColorMatrix1:
   0.8642 -0.3058 -0.0243
  -0.3999  1.1033  0.3422
  -0.0453  0.1099  0.7814

ColorMatrix2:
   0.8198 -0.2239 -0.0724
  -0.4871  1.2389  0.2798
  -0.1043  0.2050  0.7181

ForwardMatrix1:
  0.7132  0.1579  0.0931
  0.2379  0.8888 -0.1267
  0.0316 -0.3024  1.0959

Forwardmatrix2
  0.6876  0.3081 -0.0314
  0.2676  1.0343 -0.3019
  0.0151 -0.1801  0.9901
For the processing of an image, following all the steps stated in the DNG specification, we should use some matrices which for the case of our image actually are the identity matrix, which in scalar multiplications corresponds to a factor of 1. As all the calculations we need to do are matrix multiplications, this means we can ignore those identity matrices, and for the sake of simplicity we will do that, we won't even talk about them. If you want to know the complete procedure, in particular required when those matrices are not identities, you can follow this link to get the Adobe DNG Specification.
You may notice we have got pairs of metadata values, with suffix "1" and "2". This is because we have the Color Matrix and the Forward Matrix corresponding to the illuminants identified as Calibration Illuminant 1 and 2. The basic idea explained when we used DxO Mark information still holds here: we have information about two different illuminants in order to interpolate them for the actual illuminant used to lit the scene in our image file. However, the metadata in the DNG file, is intended to get the XYZ color coordinates for our final image with the CIE illuminant D50 as white point (XYZ D50). We will need some additional transformations to get the sRGB coordinates, which besides has D65 as white point.
The DNG Color Matrices in this context don't have the same meaning they had when we used DxO Mark information. They transform XYZ coordinates to the camera raw space and are useful to get the scene illuminant CCT using the XYZ coordinates of the camera neutral colors, we will see this process with full detail later.
In this exercise, we will use the white patch as our reference camera neutral color. In other words, we will use the Color Matrices to find the scene illuminant CCT which will white-balance the white patch in our photo, then we will use such CCT to interpolate the Forward Matrices, that interpolated matrix is what we will use in the processing of our image.
The Forward Matrices transform white-balanced camera raw colors to the XYZ D50 color space. To transform color coordinates from the XYZ space to sRGB we will use the matrix given in Wikipedia:
XYZD65_to_sRGB:
 3.2406  -1.5372   -0.4986
-0.9689   1.8758    0.0415
 0.0557  -0.2040    1.0570
But before to that we have to transform the XYZ D50 color coordinates coming from the interpolated Forward Matrix to the XYZ D65 space. We will do that using the Bradford adaptation method. From this page in Bruce Lindbloom site we get the Matrix required for that transformation:
XYZD50_to_XYZD65:
 0.9555766 -0.0230393  0.0631636
-0.0282895  1.0099416  0.0210077
 0.0122982 -0.0204830  1.3299098
Assembling all these last steps, we will transform camera raw colors (CameraRaw) to sRGB using the following matrix multiplications:
sRGB = XYZD65_to_sRGB * XYZD50_to_XYZD65 * ForwardMatrix(wbCCT) * rawWB * CameraRaw
- Where the resulting sRGB values have —of course— linear brightness, so we should gamma correct them later.
- The Forward Matrix depends on (is a function of) the scene illuminant CCT we will find using the Color Matrices.
- The rawWB factor contains the scales required to white balance the raw camera values. As we will use the white patch to find the scene illuminant CCT, the white-balance scales will transform the neutral colors —and in particular the white patch raw RGB coordinates— resulting
R = G = B. - Once we have all the factors multiplying the CameraRaw values, we will multiply all of them (matrices are associative), so at the end we will use the ImageJ colorMatrix script with just that resulting matrix.
Notice in the formula above, how we translate color coordinates from the camera raw space (input device) to the XYZ one, and from there to the sRGB space (output profile), just like an input and an output profile will do.
In a computer with a profiled monitor, the applications can use that monitor profile (output profile) to translate the color coordinates from the image sRGB space to the monitor color space, allowing the best possible color accuracy. When an application (e.g. an Internet browser) is capable of that, it is called "Color Managed".
In the finding of the illuminant CCT, we will use a diagram in the CIE 1960 UCS uv space with the Planckian Locus to "visually" estimate the CCT corresponding to a given color. We draw the Planckian locus using the following VB function, plotting the locus from 2,500°K to 10,000 °K with 250°K steps.
'--------------------------------------------------
' Planckian locus on the 1960 UCS color space
'
' The formulas are taken from:
' http://en.wikipedia.org/wiki/Planckian_locus
'
' This function returns an array with two values
' corresponding to the uv coordinates of the given
' temp parameter.
'--------------------------------------------------
Function uv1960PlanckianLocus(ByVal temp As Double) As Variant

    Dim uv() As Double
    ReDim uv(1 To 2)

    uv(1) = (0.860117757 + 0.000154118254 * temp + 0.000000128641212 * temp * temp) / (1 + 0.000842420235 * temp + 0.000000708145163 * temp * temp)
    uv(2) = (0.317398726 + 0.0000422806245 * temp + 4.20481691E-08 * temp * temp) / (1 - 0.0000289741816 * temp + 0.000000161456053 * temp * temp)

    uv1960PlanckianLocus = uv
End Function
We will also draw the CIE D Locus together with the Planckian Locus, with marks on the illuminants D50, D55, D65 and D75 using the the following VB formula.
'--------------------------------------------------
' Convert a given temp to xy coordinates for the
' CIE D locus.
'
' The formula is taken from Bruce Lindbloom site:
' http://www.brucelindbloom.com/Eqn_T_to_xy.html
'
' D50: 5002.78 ºK
' D55: 5503.06 ºK
' D65: 6502.61 ºK
' D75: 7504.17 ºK
'--------------------------------------------------
Public Function cieDLocus(ByRef temp As Double) As Variant
'
    Dim xy() As Double
    ReDim xy(1 To 2)

    If (temp >= 4000) And (temp <= 7000) Then
        xy(1) = ((-4607000000# / temp + 2967800#) / temp + 99.11) / temp + 0.244063
    Else
        xy(1) = ((-2006400000# / temp + 1901800#) / temp + 247.48) / temp + 0.23704
    End If

    xy(2) = (-3 * xy(1) + 2.87) * xy(1) - 0.275

    cieDLocus = xy
End Function
The conversion from XYZ to xy is very easy, x = X / (X + Y + Z) and y = Y / (X + Y + Z). The conversion from xy to CIE 1960 UCS uv coordinates is also easy, but is even easier using the following VB function. It is also a way to be sure of not making mistakes in the calculations.
'--------------------------------------------------
' Convert xy coordinates to 1960 UCS uv coordinates
'--------------------------------------------------
Function xy_to_uv1960(ByRef xy As Range) As Variant
'
    Dim uv() As Double
    ReDim uv(1 To 2)

    Dim denom As Double
    denom = (12 * xy(2) - 2 * xy(1) + 3)

    uv(1) = 4 * xy(1) / denom
    uv(2) = 6 * xy(2) / denom

    xy_to_uv1960 = uv
End Function
Notice this VB functions return an array of values (on a row), so we have to use this functions as required for Excel formulas returning arrays, which is explained in this page.
Let's do this
We have to interpolate between the two DNG Color Matrices in the same way we did before with the DxO Mark matrices: the interpolation is based on the CCT reciprocal value. The easiest way to do this is building a spreadsheet matrix interpolating the two DNG color matrices as function of a given CCT value in some spreadsheet cell.
As the interpolated matrix —with a given CCT— transforms XYZ values to the camera raw space, if we invert that matrix the resulting one will convert camera raw color values to the XYZ space. If we would have the CCT of the illuminant of our photo scene, the inverse of the interpolated matrix —with that scene CCT— will transform the camera raw white patch color coordinates to the XYZ space, and the chromaticity of that XYZ point would have as the closer point in the Planckian Locus the one corresponding to the scene CCT.
As we don't know the scene CCT, we will start with a guessed CCT, get the inverse of the color matrix interpolated with that guess, and pre-multiply that matrix with the white patch camera raw RGB color to get the XYZ coordinates of that patch, then we will convert those XYZ coordinates to xy and finally to the CIE 1960 UCS uv coordinates. We will draw that uv point in a diagram with the Planckian locus, draw an imaginary line perpendicular to —and intersecting with— the Planckian Locus and pick the CCT of that intersection as the new "refined" CCT guess. We will iterate this way, getting better CCTs until —hopefully— the process will converge to the same CCT.
During this process we won't use directly the camera raw coordinates. We will normalize them to the range [0, 1] dividing them by 16,383, which is the maximum possible value for the RGB color components in our 14-bit raw image file.
As the photo was taken with direct sunlight, we would start with the illuminant D50 CCT as the starting point. However, at the end of the processing with DxO Mark matrices we found the CIE illuminant A has better results neutralizing both, the gray and white patch, so let's start from this point to see what we get.
The average raw camera values from a small area in the white patch has RGB values equal to (7522, 14566, 10411), normalizing them to [0, 1] they become (45.91%, 88.91%, 63.55%). Pre-multiplying thee normalized-raw-values by the inverse of the Color Matrix 2 (the one corresponding to the illuminant A, our CCT guessed value), we get the white patch color in XYZ space equal to (0.8674, 0.8913, 0.7382) which in the xy chromaticity space is (0.3474, 0.3570) and in the CIE 1960 UCS uv space is (0.2109, 0.3251). Placing that point in the uv space together with the Planckian and the CIE D Locus bring us the picture shown below.
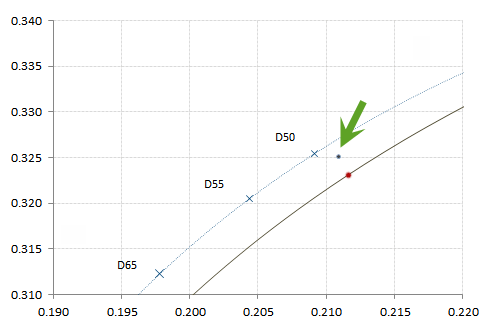
The top curve is the CIE D locus, and the bottom one is the Planckian locus. The point aimed by the green arrow is our first approximation using 2,856°K as CCT (CIE illuminant A). The closer point in the Planckian locus (the red point) corresponds approximately to 5,000°K.
Now we will do another iteration, but this time we will interpolate the color matrices with 5,000°K as CCT. We get (0.8687, 0.8888, 0.7527) as XYZ coordinates and (0.2111, 0.3240) as uv coordinates for the white patch, as shown aimed by the green arrow in the picture below.
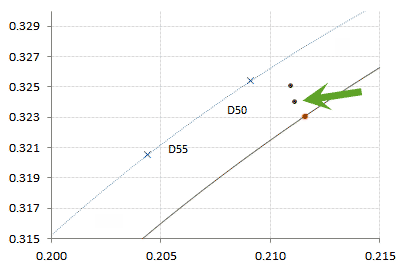
The point aimed by the green arrow is our second approximation using 5,000°K as CCT. The closer point in the Planckian locus (the red point) corresponds roughly to 4,995°K.
We iterate again, this time with a CCT of 4,995°K, just to get again (0.2111, 0.3240) as uv coordinates. We have convergence on the xy chromaticity space with a value of (0.3461, 0.3541). As we were doing "visual estimations" of the CCT, this last time we will use the Bruce Lindbloom color calculator to get a finer CCT value, the result is 4,970.6°K. If we check a new iteration with this value, we still get the same xy value and consider this step completed.
If we recall our formula to get the sRGB linear values from the camera raw RGB values, we can update it knowing the White Balance CCT required for our photo is 4,971°K:
sRGB = XYZD65_to_sRGB * XYZD50_to_XYZD65 * ForwardMatrix(4971°K) * rawWB * CameraRaw
Interpolating the Forward Matrices for 4,971°K we get:
ForwardMatrix(4971°K):
0.69378   0.27186  -0.00136
0.26043   0.99919  -0.25962
0.01908  -0.20961   1.01563
The only missing information is the rawWB matrix, which contains the scales to white balance (make R = G = B for the neutral colors) the camera raw RGB values. We can get that term by inverting the matrix having as diagonal our reference neutral color (45.91%, 88.91%, 63.55%), from the image white patch. Doing that, we get as result a matrix having as diagonal (2.1780, 1.1247, 1.5736). To reduce these scales while keeping the proportion between them, we will divide them by the minimum value among them (2.1780, 1.1247, 1.5736)/1.1247 and we get:
rawWB:
1.93645   0         0
0         1         0
0         0         1.39910
Now we have all the required information. If we multiply the four matrices (XYZD65_to_sRGB, XYZD50_to_XYZD65, ForwardMatrix(4971°K), rawWB) we get:
 3.37685  -0.66077   -0.11589
-0.34700   1.64138   -0.64662
 0.03317  -0.50370    2.07941
Finally, we can use this matrix to transform the camera raw RGB values to sRGB. As we did with DxO Mark matrices, we will use as input our channels with the pinkish highlight issue corrected (raw_phc_r, raw_phc_g, raw_phc_b) using the ImageJ colorMatrix script. The resulting image is shown below.
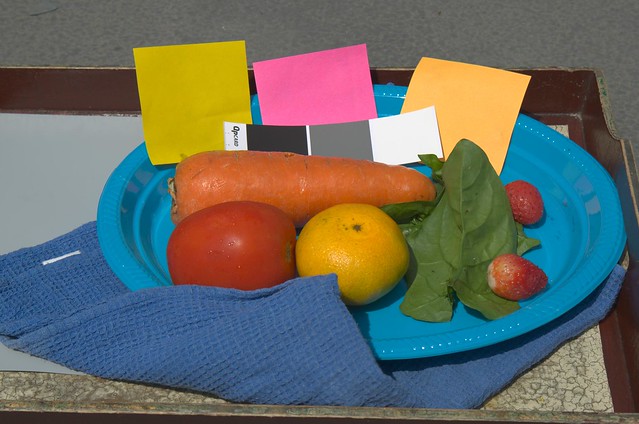
This is the image resulting from processing our camera raw file using the information extracted from the conversion of that file to the DNG format.
Tone Curve
Comparing what we have now with what we got in our first (wrongly) attempt, we have made a great progress. However, the image still looks dull. What happens is the Gamma Correction we have used, is not the best tonal curve for our raw photo. A tonal curve transforms the input luminosity to an output luminosity, usually with input and output values normalized to fit in the range [0, 1].
A more appropriate Tone Curve for the camera and model used to take the photo we are processing is embedded in the DNG conversion of our raw photo file. You can get those values using Exif Tool Gui (under the tag ProfileToneCurve C6FC.H) as we did before to get the matrices. I am not sure if this Tone Curve depends on the camera brand and model or is just a common curve for all raw camera files, which wouldn't be very strange, because all the raw camera image files are expected to have linear luminosity.
The list of values we got from the DNG file are shown below, to get all of them expand that list.
  Input      DNG TC
  0.0000000  0.0000000
  0.0158730  0.0124980
  0.0317460  0.0411199
Show me the missing part of the list...
In the following picture we can compare the 2.2 Gamma Correction (red curve) with the DNG tone curve (blue curve). In both cases the input is the raw linear luminosity. By seeing the relationship between both lines we can notice how the —blue— DNG curve describes the typical "add contrast" S curve with respect to the —red— Gamma Correction curve, which means it brings an image with more contrast.
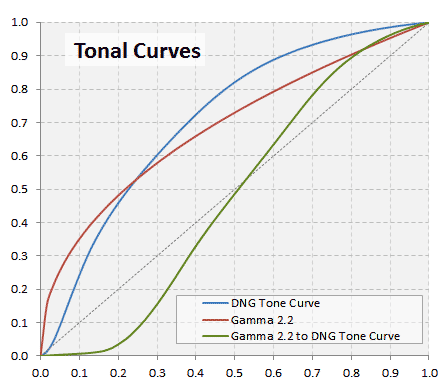
The Gamma Correction curve and the '.DNG' Tonal Curve (DTC). Notice how the DTC has relatively more contrast.
The green curve represents the tonal adjustment we should do to an image which already has the Gamma Correction applied. This curve reverses the Gamma Correction and then applies the DNG Tone Curve. To get this curve we have interpolated the DNG curve using a cubic Bezier. However, it is like plotting the DNG Tonal curve (Y) against the Gamma Correction curve (X).
For the luminosity below 0.1 —as we can see in the green curve— it is difficult to apply this correction without clipping to zero those luminosity values. It is more precise to reverse the Gamma Correction (applying a 1/2.2 Gamma curve) —or start with the linear image— and then apply the DNG Tone Curve.
Comparing the green curve with the black dotted diagonal is like comparing the DNG Tone Curve with the Gamma Correction curve: The DNG Tone Curve has a steeper and almost straight slope for most of the middle tones, it raises a little bit the middle tone to around 0.52, and add contrast brightening the lights and darkening more the shadows. As a result, we will get a much better image.
In order to use the DNG tone curve, we will build again the sRGB images using the matrices we have found so far:
DxO Mark D50 Matrix
 3.6156  -0.8100  -0.0837
-0.3094   1.5500  -0.5439
 0.0967  -0.4700   1.9805

Derived form DxO Matrices: Minimizing saturation of gray & white patches
 3.49713  -0.71677 -0.10183
-0.46523   1.51005 -0.37519
 0.14861  -0.68309  2.24972

DNG embedded matrices: Interpolated according to DNG specification
 3.3769  -0.6608  -0.1159
-0.3470   1.6414  -0.6466
 0.0332  -0.5037   2.0794
But now we won't apply the Gamma Correction (using Gamma = 1 in the colorMatrix script). Instead, we will save the RGB resulting channels as 16 bit images (use the command "Image » Type » 16-bit", then "File » Save As » Tiff...") and we will merge them as a single tiff image in Photoshop, by creating a new image and copy/pasting those RGB channels in the new image ones, then we will assign "sRGB IEC61966-2.1" as the image color profile.
We will apply the DNG Tone Curve to each linear .tif image using a regular Photoshop curve. You can download that curve form here. Finally, to standardize the luminance of the resulting images, we will add a Photoshop "Levels" adjustment and we will set only the middle tone to get the gray patch at 50% of brightness (in HSB coordinates). In the gadget below we show the result, including the Lightroom one, which was also "standardized" at 50% brightness for the gray patch.
As we can see, now we have good results, at the same quality level of a good raw processing application!. The DNG and the DxO Mark D50 images are almost equal, this is not a surprise because the DNG resulting interpolation CCT was 4971°K, very close to 5003°K corresponding to D50.
Shifting Hues
We have to consider that any tone curve applied as naively as we do with the Gamma Correction (when using the colorMatrix script), hurts the color precision from the matrix so carefully crafted. For example, if we have a linear sRGB color like (R:95%, G:24%, B:5%) when we apply a "naive" Gamma correction it becomes to (R:98%, G:52%, B:26%) and the color components change without keeping the relative proportion among them. Because of that, where we had a reddish color we end up with an orangish one (the hue changes from 11° to 22°). Both colors in a sRGB image are shown in the following image.
I guess that most of the raw processing software should be taking the precautions to avoid this hue shifting during Gamma Correction and in general when applying a tone curve, but we don't know for sure. For example, RawTherapee to fight this shifting, has 4 possible modes to choose from, when applying a tone curve and Photoshop has blending modes, but none of them let you choose how the Gamma Correction is applied to avoid hue shifting.
Correction of Shifting Hues
To the images the we just process and show above, we will add in Photoshop —on top of them— the original linear .tiff image, using Hue as blending mode and 80% of opacity, to recover most of the hues somewhat distorted for the .DNG tone curve.
In general, the tangerine and the rightmost post-it in the background looks more orangish and less yellowish as they really were.
The colors in the "DxO Mark (WB Mini)" are not good now, in particular for the tangerine. This makes sense considering during the interpolation and White-Balance optimization we consider the effect of Gamma Correction in the minimized saturations. In other words, the matrix in this case was designed to counterbalance the effect of Gamma Correction: The matrix needs the Gamma Correction hue shifting for a good result, so the linear hues we see here are not what the optimization expected to show. Besides, here we are not using Gamma Correction but the DNG Tone Curve.
The best results are: this last DNG and the "DxO Mark (WB Mini)" without the Hue correction:
Final Thoughts
Raw image processing using only a color matrix, as we have done here, usually yields good results (assuming the matrix is the adequate to photo scene illuminant), but by itself only can not bring more color accuracy above some level. Moreover, these color matrix characteristics are not very different from camera to camera as we will see.
The DxO Mark web site measures how good the color matrix can render the expected colors with the Sensitivity Metamerism Index (SMI), which is built from the average error between the rendering using the color matrix and the expected real color. What they do is to take a photo to a Gretag Mcbeth color chart (containing 18 color patches) under a known illuminant and they use the camera raw data from that photo to mathematically calculate the color conversion matrix that has the minimum average error (usually minimizing the RMS error) converting the camera raw RGB colors to the sRGB known values of the color patches. This minimum average error (AvgError) is used to derive the SMI index by the formula:
SMI = 100 - 5.5 * AvgError
Notice, this error is just "indicative" of how well the resulting matrix is for converting colors from the raw camera space to the sRGB space, because it is just the average error for the 18 color chart patches, which is a pretty small set of colors.
If we look the SMI index for the best ranked cameras and calculate the AvgError, we will find for the top overall DSLR camera (Nikon D800E) and for the top two in color sensitivity (Phase One IQ180 and Phase One P65Plus) the following values for the illuminant D50:
| Brand | Model | AvgError | Indicative Price (USD) |
|---|---|---|---|
| Nikon | D800E | 4.18 | 3,300.00 |
| Phase One | IQ180 | 3.64 | 42,490.00 |
| Phase One | P65Plus | 4.36 | 29,900.00 |
| Nikon | D7000 | 4.00 | 1,200.00 |
It is clear that for very small differences all these cameras are around the 4.0 average color error and that this error is not indicative of their quality. The DxO Mark web site says this average error ranges between 4.5 and 2.7 for DSLR cameras. This means the camera raw colors pretty much follows a linear relationship with the "real colors" from the photographed scene, but this relationship is not perfectly linear.
From a theoretical point of view, a sensor with a matrix without error in the whole visible spectrum would mean the sensor has the same response as the average human eye, which at this moment is not possible. This makes more understandable why a color matrix can not possible render colors with an accuracy beyond some limit imposed by the current state of the art in digital photography.
For a better understanding about what a color matrix is trying to solve, we must realize we really don't want the colors that physically hit each photosite, we want the colors we see in the scene, which is quite a different need.
The human vision has a feature called Color Constancy which allows us to adapt to the current illumination conditions and see the same colors despite of the illuminant color. Usually we are not fully aware of the degree of this adaptation until we see a photo developed without the white balance required for the used illuminant. For example, I have just seen a video where the colors have a reddish cast because the illumination is reflecting on the red bricks on the wall.


The 'Before (left)' image has the reddish color casting caused by the wall bricks. The 'After (right)' is closer to what the audience in the lecturer room have seen.
The audience in the same room as the lecturer, after few minutes of adaptation, surely won't see the red cast. Nonetheless, that reddish casting is in the light hitting the sensor photosites, and once we are adapted to a different illumination condition (e.g. a computer screen), we can clearly see the reddish casting, but we don't want to see the "physical" colors —in the light coming from the objects— we want to see the colors as if we were adapted to that lecture room illumination!
Once we have understood the current accuracy limit of the color matrices, the question is, How can we get a smaller color error than those we have seen in the table above? The answer is yes, with a better crafted color profile.
The color profiles allow to convert colors from the camera raw space to a known color space not only by the use of a color matrix. In an input color profile, it is possible to have a 3D mapping table, where having as input the raw RGB components of a color it will directly give us the corresponding color coordinates in a known color space. This way, it doesn't matter if the camera sensor has a color response not perfectly linear with regard the human eye response, because it is not based on that linearity —as the color matrix is— is always possible to have the perfect matching with the real colors, for all the colors the camera "can see".
Because it is not an easy task to build that kind of profile, they are not freely available, they are a trade secret, copyright protected. We can usually access them by using the camera manufacturer raw processing software. The camera input profiles used by Nikon Capture NX 2 (CNX2) use this mechanism. That's why the color rendition of CNX2 is usually better than in other raw processing software. The same happens with Canon raw processing software.
If you don't want or can't use your camera manufacturer raw processing software or if they don't provide such software, you can extract the embedded data in the .DNG files and build your own ".dcp" input color profile by using the Adobe DNG Profile Editor, which is free. As we have seen in this wiki series, that embedded information supports the processing of raw images using color matrices. However, the DNG Profile Editor allows additional tweaking to those profiles which goes well beyond the limit imposed by only the use of color matrices and their inherent limits we have seen.
Another interesting question is: Do we really want a smaller color error? This question is related to how a photo, processed in the pursuit of different goals, may require realistic colors (with smaller color error) or creative colors (regardless of the color error). For example, a photo for a fabric catalog, in a forensic investigation, or just for a need of taste, will want realistic colors, whilst another photo —for advertising— will look for an eye catching image, with colors that will be considered beautiful by the audience, completely disregarding the real scene colors.
These requirements of realistic or creative colors clearly did not arise with the digital photography era, they are inherited from the film photography times. In the film era, these requirements were satisfied with different color positive (slides) and color negative types of films, with each of them bringing characteristic saturation, contrast (tone curve), hue and noise. Nowadays we just have more powerful creative options processing raw image files. Actually, there is even image processing software also emulating the behavior of those films, for example DxO FilmPack, VSCO Lightroom presets, or Nik Collection - Analog Efex Pro.
Considering the different intends, most raw photo processing software come with processing profiles with names as "Portrait", "Landscape", or "Vivid". These processing profiles are presets for settings as Sharpening, White Balance, Contrast, Brightness, Saturation and Hue. In such cases, the "Neutral" profile —usually— is the one provided for a more realistic representation. In some cameras you can even tweak at your will these presets.
These processing profiles are also available as in-camera settings for ".jpg" users. Some raw processing software use this settings as default values for the initial processing of the image but after that you can override those settings and use more precise software controls to get the style you want.
