Highlight Clipping in Lightroom
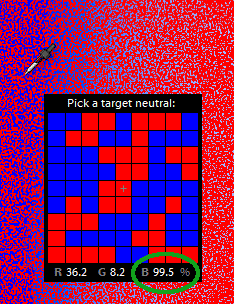
When LR shows the highlight clipping (HLC), it is telling us that with the current parameters, one or more of the image (RGB) channels, for some pixels, require a value that should be higher than is possible and it is being clipped to the maximum allowed value.
For example, for some pixel values the green channel should be 107%, but as that is not possible it is actually clipped to just 100%. As a consequence of that, the color for those pixels affected by the clipping will show a different color than they should or the detail in that area of the image is lost.
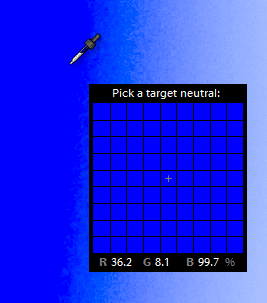
In the previous image the blue channel is the one being clipped. However, it is tone value is not at 100%. The LR internal color space and its algorithms preventing or recovering for overexposing not so easy get to 100% values, except when some the raw image channels are already clipped.
The same area of the above image, but this time without showing the highlight clipping (HLC) mask, is shown below:
I have read in some articles that the red mask, showing the HLC, is indication of loosing detail in that red channel; cyan indicating loosing detail in the blue and green ones and so on. But as we can see in this example, that is not (at least not always) the case.
Here we are loosing detail in the clipped blue channel; but if LR would show that clipping with a blue mask, we wouldn't be able to distinguish the image blue area from that blue mask. That's the reason why —cleverly— LR shows the HLC with a red mask instead. In cases when there is blue HLC but the image dose not have the blue as the dominant color in the area, LR will show the HLC with a blue mask.
When none of the raw data channels is clipped, the shadow and highlight clipping occurs when the color from the camera raw space is outside the working color space used by the image editing software. Nonetheless, in the case of LR we don't set the working color space. It uses the ProPhoto RGB space with the sRGB tonal curve (sometimes called Melissa color space).
The Melissa color Space
The following image shows the projection of the ProPhoto colors in the CIE 1931 xy (chromaticity) space, which is a very large color space, in the sense that encompasses almost all the visible colors by the human eye, (91.2 % of them). As reference, the sRGB and Adobe RGB spaces contain —respectively— only the 35% and 50% of them.
These ratios of the size of the spaces are not calculated with respect to the areas in the xy space but in the Lab 3D space.
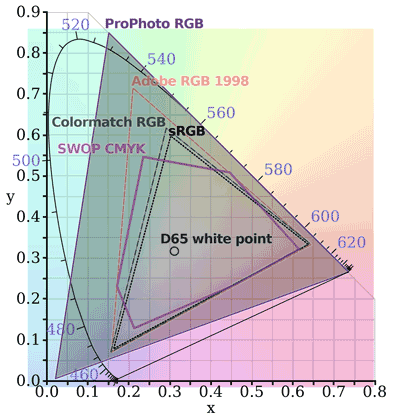
ProPhoto gamut comparison in CIE1931xy space, courtesy by BenRG and cmglee (Licensed under CC BY-SA 3.0).
Because of the use of such a big color space, when the raw data is not already clipped, and you just opened an image, LR will seldom show HLC from a natural image (portrait, landscape, etc.). The HLC I am showing occurs in an image that comes from an overexposed shot to my computer screen, showing part of the the Photoshop Espectro color gradient.
Screen and Final Image HLCs
Be aware, that not having shadow or highlight clippings in the LR editing (screen) space does not mean you won't have it in your final image.
If you export your image as a 16-bit file using the ProPhoto space, you will have the same (or none) clippings as in your screen; but if you export the image as a sRGB or Adobe RGB file, there are greater chances to have HLCs on them. To check that, you should use the Soft Proofing feature in LR.
In the image we have being used as example; if I decrease the saturation by -14, all the HLCs are gone, and the image seems unchanged. Nonetheless, if I use the Soft Proofing feature for the sRGB profile, I find out a lot of HLC, indicated by the red mask at the left image in the following figure:

There is none highlight clippings in LR the editing space. (Soft sRGB gamut Proofing) However, they are in sRGB (left image) space and (Soft screen Proofing) in my screen space (right image).
We should use that Soft Proofing feature more often, looking for image details that maybe we are not aware just because they are inside the ProPhoto space (not shown as clipping) but outside our screen capability (not visible in our screen).
The best way to do this is profiling the screen and clicking or hovering the screen icon (Show monitor gamut warning) that appears at the top left corner of the histogram when we turn on the LR Soft Proofing feature.
The best next thing you can do about the screen HLCs; is to google, download and install your screen standard .icc profile. Notice that this standard profile won't exactly portray your screen, because there are may factors affecting the way it shows an image, from its age and viewing conditions, to its current settings about brightness, contrast, white point and so on.
However, having that profile is a lot better than nothing. It will probably correspond to the best possible screen settings and viewing conditions; which means this profile will show what is at least clipped in your screen; and very probably a bit more is clipped in your particular case.
I did this with mine, and the above image shows at the left side the HLC in sRGB and the ones in my screen profile at the right side.
When I lowered the saturation in my image to get rid of the editing HLC, I said I didn't noticed a change. That is understandable looking my screen HLCs in the image above, they exist over the editing HLC area and more; this means there is HLC in my screen image even after the correction; so —before and after— I lowered the saturation, I have colors beyond what by screen is capable to show and thats why I didn't see a change.
If we find out HLC in our screen soft profiling, we should manipulate the image, at least temporarily, to get rid of those HLC and check if behind them there are details or features we want to preserve for the final image.
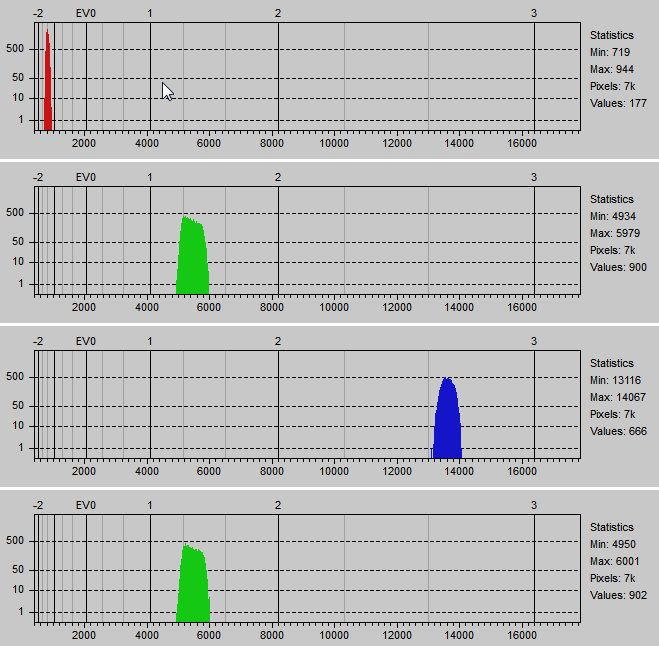
Coming back to the HLC in the LR editing space, the following image shows the raw data histogram of an area shown in LR as having the blue highlight clipping we that show at the beginning:
Observe there is not raw highlight clipping, which would occur at the EV3 mark. However the blue color is very high. Clearly, this HLC is not caused by clipped raw data. It is a problem of a color not fitting in the LR editing space. We will call soft-HLC to this kind of HLC.
Sometimes occurs something in the other way around: the raw data is clipped but the LR image don't. For example, the following image is from a screen shot of LR showing a raw photo, with only the white balance adjusted; and the exposure temporarily decreased -2.29 just to better notice the image features:
When the LR exposure is zero (default) and the Show Clippings is turned on, LR doesn't show any HLC. However, if we check the raw image; in the bottom right part we will found it is severely overexposed and their raw channels have HLC:
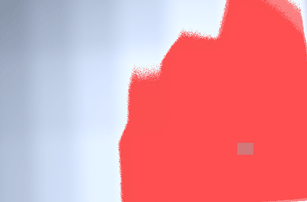
Raw image data showing highlight clipping. All the channels but the red one are clipped. The red mask shows the area with HLC.
In the image above, the red mask shows the area with HLC. If we check the histogram of the grayish rectangle in the red masked area in the above image, we will found this:
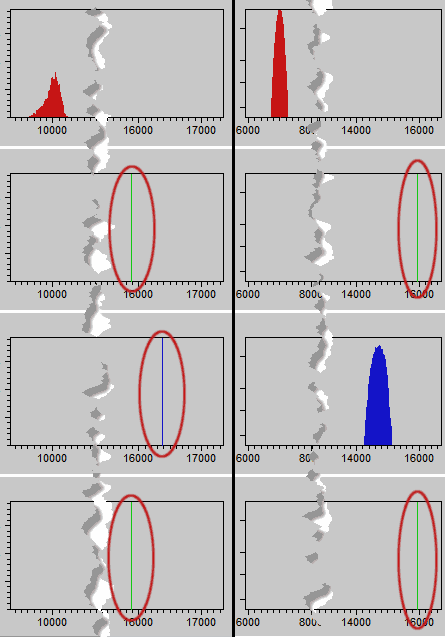
Image raw pixel value histograms from two areas with raw HLC. Notice at the left histogram that all but the red channel are totally clipped at their maximum raw value. At the right histogram only the green channel are clipped
If we look at the pixels with those clipped channels. They are not above of 99% which seems is when LR shows the HLC.
Under this circumstances, it is amazing —if not weird— not to find any HLC in LR. Even when LR doesn't mark those areas as with HLC, they have it; the data in those clipped channels is lost. We will call raw-HLC to this kind of HLC.
Notice in the LR image the top left area is a little bit blue, but the bottom right one is neutral. LR is doing a highlight clipping recovering in that bottom right part of the image, using the tones in the red channel —the only one with data— and showing this part without any color (neutral), because with two clipped raw data channels, the color information is lost for this part of the image.
Handling the Highlight Clippings
A Highlight Clipping is not necessarily an issue we have to fix. To decide if a HLC should be fixed, check if it causes a loss of detail that the final viewer should see. If the answer to this is yes, then the HLC is a defect that needs correction; otherwise, it is not.
The HLC may cause two different problems, depending on what kind of detail is lost: luminance or color information. We will see below in more detail this kinds of HLC, with examples when there is, or not, need to fix them.
An example of lost luminance detail is when you have blown out clouds, where you can not see their shape or structure. What is lost is not too much about color detail. Here, what is lost is rather monochromatic information, like in the following example. This is the most common case where you need to recover the lost detail, because the human eye is more sensitive to the luminance detail (or the lack of it) than to the color detail.
An example of HLC causing irrelevant loss of luminance detail, is a reflection or glare on glass, like on a windshield or sun glasses, or in a flat patch of snow on a cliff or a mountain; assuming that in those areas there is no relevant detail to see.
The HLC causes the loss of color detail when it changes the hue or intensity of a color, or when causes the loss of a color based texture.
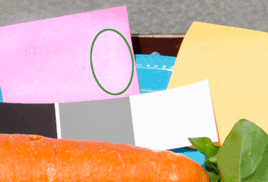
An example of HLC, causing relevant loss of color detail, is light reflections in a person skin; or like in the following example, where the HLC makes the post-it look colorless.
A good example of irrelevant lost of color detail, caused by HLC, is in our first image example, with clipped blue channel; there is nothing relevant in the subtle change of hue, lost by the clipped blue.
Notice the decision in most of the examples is rather subjective. Depends on the rendering intent and the final viewer needs.
Fixing the Highlight Clippings
We have seen we don't have to fix every HLC in an image. But when we really have to, what can we do?
Fixing raw-HLC
When there is raw-HLC, there is nothing we can do to really fix it in LR. We can just mitigate its appearance; if we are lucky, it will pass unnoticed.
As we have seen, LR does its best effort to reduce its consequences. It doesn't even mark them as HLC, except when all the raw channels are already clipped! So, if the image look doesn't tell you there is a problem, there is nothing to fix there; but if it does, you may face a hard time to solve the situation in LR.
If you don't have the skills and tools (like photoshop) to fix this; or even though having them, there is a chance to have lost the shot.
This is a situation we should correct in-camera, avoiding over exposures over the camera sensor limits. This can be handled —if possible— taking two or more shots with one or more of them exposing for the highlights; then you can do merge them "by hand" in a photoshop-like tool or using HDR.
Fixing soft-HLC
We can fix or diminish the effect of the soft-HLC by decreasing the brightness, changing the white balance, diminishing the saturation, adjusting the hue/luminance/saturation of the tone in the HLC, or using a mix of all of this tools. We can do this in a mix of local and global adjustments to fix the issue without hurting the image.
Knowing your Camera Raw Limits
My Nikon D7000 sensor camera, at ISO speed 100, sometimes clips the green channel at 15962 ADU, 15876 ADU or 15778 ADU. However, always clips the other channels at 16383 ADU. From a photo development point of view, the range of raw data is [0, 16383] (the highest clipping point) but from an exposure profiling perspective the base top range is [0, 15778] (the lowest clipping point).
To find your camera clipping points, you can shoot to a gradient from gray to white in your screen, using increasing exposure times, starting 3 2/3 stop above your camera exposure metering (close to the clipping level). Do this until all the raw channels are clipped.
You can measure the raw values with Rawdigger. You will notice the clipping when you find the kind of histogram shown in the following image, with a completely vertical right side. The clipping value is the maximum value shown in the histogram statistics.
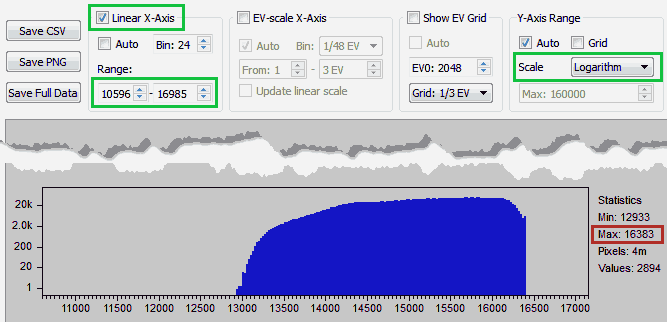
Raw clipping. Play with the controls with green frames to get a better look of the histogram. The clipping value is shown with a red frame in the statistics section.
Play with the controls with green frames to get a better look of the histogram.
Raw Limit from a Photo Development point of view
Do you remember the first image in the previous section, with blue HLC? Its blue raw channel histogram shows values close to 14,000 ADu. What is the range of this blue scale? or in other words: What is the raw value that corresponds to 100% raw blue? It is 16383 ADU, right? Why not 15778 ADU?, in sync with the maximum possible green value.
If we think about situations like in that image in the previous section, we can imagine other ones with blue values greater than 15778 ADU but of course below their maximum possible 16383 ADU value. However, if LR would use 15778 ADU as the top blue value, those blue tones above that limit would be above 100% blue and as consequence they would be in fact HLC. But that would be a "false HLC" because they are really not clipped.
I have not a particular example showing this behavior, but after seeing raw-HLC in two of three channels not reported by LR as a HLC, I can bet it wont cause a false blue HLC by using a too short blue top limit. But what about using 16383 ADU for the blue channel but a different limit for the green raw channel? Well, that is not right, that conversion would break the linearity of the raw data.
Raw Limit from an Exposure Profiling Perspective
On the other hand, when profiling the camera exposure, I don't want to get raw-HLC in the green channel just by wrongly planning exposures to reach 16383 ADU, when this channels is clipped at a lower value. To be sure, the base limit must be the lowest of the known clipping points, which is 15776 ADU.
However, this value is a base because as any CMOS camera its noise follows approximately a Normal distribution which means half of the pixel values will be below the mean pixel value and the other half above. Therefore, if I plan to get expositions with highlights up to 15776 ADU, half of them will be raw-HLC!
When we talk about noise, we refer to the fact that even when shot to a perfectly uniformly lit plain surface the pixel values are spread around a mean value, they are far to be a constant value, we have studied this in other articles.
For high exposition levels, and in particular for low ISO speeds, we probably wont see that noise in the image areas with highlights. But in fact, the pixel values are very spread around a mean value.
The higher the exposition level is (higher mean pixel value) the higher the spread of the pixel values; and technically that spread is called noise, and measured with the pixel values standard deviation.
Fortunately, we know this camera noise profile or pixel values variance; but if that wouldn't be the case, we can find the noise value at any exposition level, using the information in the DxOMark camera sensor reviews.
At a given exposition level, the pixel values from a uniformly lit plain surface will have as mean the given exposition level and $(\sigma)$ according to the known sensor noise variance.
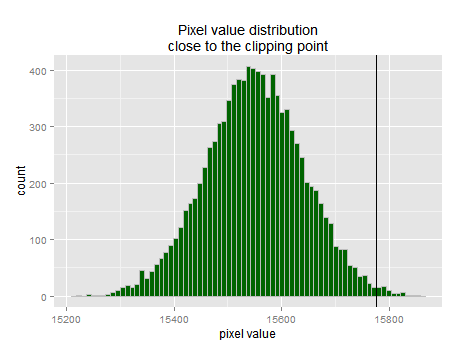
Playing with the mean pixel value (exposition level), knowing the corresponding variance, and looking for not having more than 2% of raw-HLC —empirically— we found 15550 ADU as the approximate maximum pixel value limit, with a distribution similar to this:
d7k.var <- function(mean) {
  1.67 + 0.4162*mean + 7.972e-6*mean*mean;
}

clipped.percent <- function(mean, limit) {
  sd <- sqrt(d7k.var(mean))
  pix <- data.frame(x=rnorm(10000, mean, sd))
  sum(pix$x > limit)/4000;
}

library(imgnoiser)
mean <- 15550
sd <- sqrt(d7k.var(mean))
pix <- data.frame(x=rnorm(10000, mean, sd))

ggplot(data.frame(x=pix)) +
  ggtitle('Pixel value distribution\nclose to the clipping point') +
  xlab('pixel value') +
  geom_histogram(aes(x), binwidth=9, fill='darkgreen', color='gray') +
  geom_vline(aes(xintercept=15776))
Notice that this means an exposition level of $(15550/16383 \sim 94.9% )$. This means if we aim to a 94.9% of exposure level, around the 2% of the highlights will be clipped at raw level (raw-HLC). This level corresponds to just $(log2(1/94.9%) = 0.0753)$ stops or 22.9% of a 1/3 of stop below the maximum possible raw value.
If this restriction sounds too harsh, keep in mind we are not loosing the use of those exposition values, we will use them by the spread of pixel values around the planned top limit. Being, a little bit more preventive I will settle aiming to a maximum 94% of exposure as top limit ($(\mu = 15400~{\small ADU}, \sigma = 91.11~{\small ADU})$), expecting virtually zero pixels with raw-HLC.
Find the Camera Raw Middle Gray for Lightroom
When we use the camera metering system, to find the adequate exposure level for a plain neutral surface, filling the frame, the camera will find the exposition that puts that tone in its "middle raw gray value", which means in the horizontal center of histogram, in the camera rear screen, that appears after each shot.
Also LR will set that middle gray point at the middle point of its tonal scale. We want to find exactly the raw value that LR considers the middle gray for the camera.
If we use Nikon's aperture priority (equivalent to Canon's Av) the camera will find the exposure time that is closer to get that target surface having the camera raw middle gray. However, as the exposition time possible values are not in a continuous range, sometimes we will get raw values above that middle gray and sometimes below.
We will try to find that middle raw value, shooting to a neutral surface filling the camera frame, like the computer screen showing a 50% Lab gray. We will take the shots, raising and decreasing that gray level, making sure we have after-shot histograms, in the camera rear screen, with peaks close to the left and to the right side of the histogram horizontal middle point.
With the first shots we will adjust the color balance in the target screen to get a normal raw white balance. This is considering that shots of a screen computer tend to be bluish in camera shots. To know exactly what is a normal raw white balance for your camera, you can check the White Balance Scales in the Color Response section in the Measurement tab of your camera review in DxOMark. However, most of the cameras are around R:2, G:1, B:1.5. The point here is to get in LR a regular white balance for those shots, like between [4500, 7000]°K.
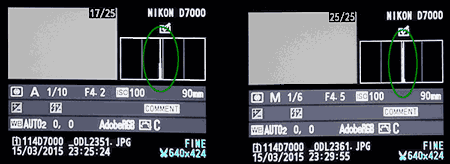
We will set the camera to use the frame center to make the exposure metering. We will use a manual focus slightly off the screen surface focus to don't get moire from the screen pixels pattern. Also we will use the in-camera picture editing functions to crop the image center to get more precise histograms of this area; and we will use Rawdigger to get the pixel raw values from a 150x100 area in the image center.
The following table shows the measured values adjusting the raw white balance, trying to get (2.11, 1, 1.5) which corresponds to D50 for my camera:
| Nbr | type | red.avg | green.avg | blue.avg |
|---|---|---|---|---|
| 1 | value | 593.4 | 1599.7 | 1691.5 |
| 1 | ratio | 2.70 | 1 | 0.95 |
| 2 | value | 753.9 | 1502.5 | 1147.7 |
| 2 | ratio | 1.99 | 1 | 1.31 |
| 3 | value | 632.5 | 1346.2 | 978.1 |
| 3 | ratio | 2.13 | 1 | 1.38 |
| 4 | value | 704.7 | 1477.8 | 998.7 |
| 4 | ratio | 2.10 | 1 | 1.48 |
After few trial and errors, we are in the ballpark. In the above table, a "value" row shows the raw pixel average value per channel measured using Rawdigger. The "ratio" row shows the ratio between the blue and green average values to the greens average one. Notice these values are in reverse relation to their desired values: if the ratio is too low we have to decrease the channel intensity to increase that ratio and vice versa.
Now we will take the shots around the horizontal middle point of the camera rear screen histograms. Checking as is shown bellow to get the peaks at both sides of the histogram horizontal center.
First, we need to set first the camera to aperture priority (Av on Canon's) to get the camera middle gray metering for the screen gray target.
Observe that it doesn't matter what tone of gray do you use to take the shots. Anyway, the camera metering system will try to put that tone of gray in the camera's raw middle gray.
After you know the metered exposition time, you can change to manual mode and play around this value and with the screen image intensity (I used the Photoshop curves tool using a straight line) to get shots with their histogram with peaks close both sides to the middle of the after shot image histogram.
| pair | Side | file.name | raw.g1 | raw.g2 | LR.point |
|---|---|---|---|---|---|
| 1 | R | _ODL2361.JPG | 52.8 | ||
| 1 | _ODL2359.NEF | 1740.7 | 1744.2 | 54.5 | |
| 2 | R+ | _ODL2358.JPG | 54.9 | ||
| 2 | _ODL2356.NEF | 1899.9 | 1903.5 | 57.2 | |
| 3 | L | _ODL2353.JPG | 49.4 | ||
| 3 | _ODL2352.NEF | 1475.8 | 1478.7 | 49.4 | |
| 4 | L | _ODL2351.JPG | 47.7 | ||
| 4 | _ODL2350.NEF | 1381.5 | 1384.7 | 47.4 | |
| 5 | L | _ODL2349.JPG | 48.3 | ||
| 5 | _ODL2348.NEF | 1433.6 | 1436.7 | 48.5 |
After taking the required shots, and made some measurements on the produced files, we got the data in the above table, containing the following variables:
pair: The table shows in one row the.jpgproduced in-camera as the minimum crop (640x424 px) from the raw file in the following row with the samepairnumber.side: Note taken after checking the camera screen histogram indicating if the peak was at the left (L) or right (R) side of the histogram.file.name: Name of the file, all from the camera.raw.g1: Mean raw pixel value from one of the green channels in a 300x200 px area on the image center. The measurement was taken using Rawdigger. This measurement is done possible from raw image files.raw.g2: Similar to the previous column but using the other green channel.LR.point: Pixel reading value at (scale percent units) from a pixel on the image center. The "View > Loupe Overlay > Guides" helps to find the image center. In the case of each raw image, it was white-balanced using this centered pixel, With zero editing values, zero sharpening and 20% noise reduction (color & luminance). In the case of.jpg.
Now we can correlate the average raw green pixel values with the LR tone value, to use that correlation and find out which raw value will LR put in the middle of its scale (50.0%).
raw.df <- data.frame(raw = c(1742.45, 1901.7, 1477.25, 1383.1, 1435.15),
                     LR  = c(54.5,      57.2,   49.4,    47.4,   48.5))
fit <- lm(raw ~ LR, data=raw.df)
summary(fit)
#> Call:
#> lm(formula = raw ~ LR, data = raw.df)
#>
#> Residuals:
#>       1       2       3       4       5
#> -9.1155  7.6132 -5.1087  6.3126  0.2984
#>
#> Coefficients:
#>               Estimate Std. Error t value Pr(>|t|)
#> (Intercept) -1125.2526    50.5847  -22.25 0.000199
#> LR             52.7857     0.9815   53.78 1.42e-05
#>
#> Residual standard error: 8.308 on 3 degrees of freedom
#> Multiple R-squared:  0.999,  Adjusted R-squared:  0.9986
#> F-statistic:  2892 on 1 and 3 DF,  p-value: 1.416e-05
#>
# Get the raw value for 50% tone in LR
predict(fit, newdata=data.frame(LR=50))
#> 1514.03
Notice the very good correlation we get, with $(R^2 = 99.9\%)$ (the closer to 1, the better the regression) and also a very good correlation p-value 1.416e-05 (lower is better).
If we use this correlation to get the raw value that corresponds to 50% LR tone, we get 1514 ADU; which certainly is a rather low value from a noise performance perspective.
Lets realize this is 1514/16383 = 9.24% linear which is very close to the half of the standard middle gray 18.4 % linear. This is too close to be a coincidence! Probably we can use 9.2% linear as rule of thumb to find any camera middle gray according to LR; we should check if this level is used in at least few other cameras before to assume that.
